Market Overview: Bitcoin Futures
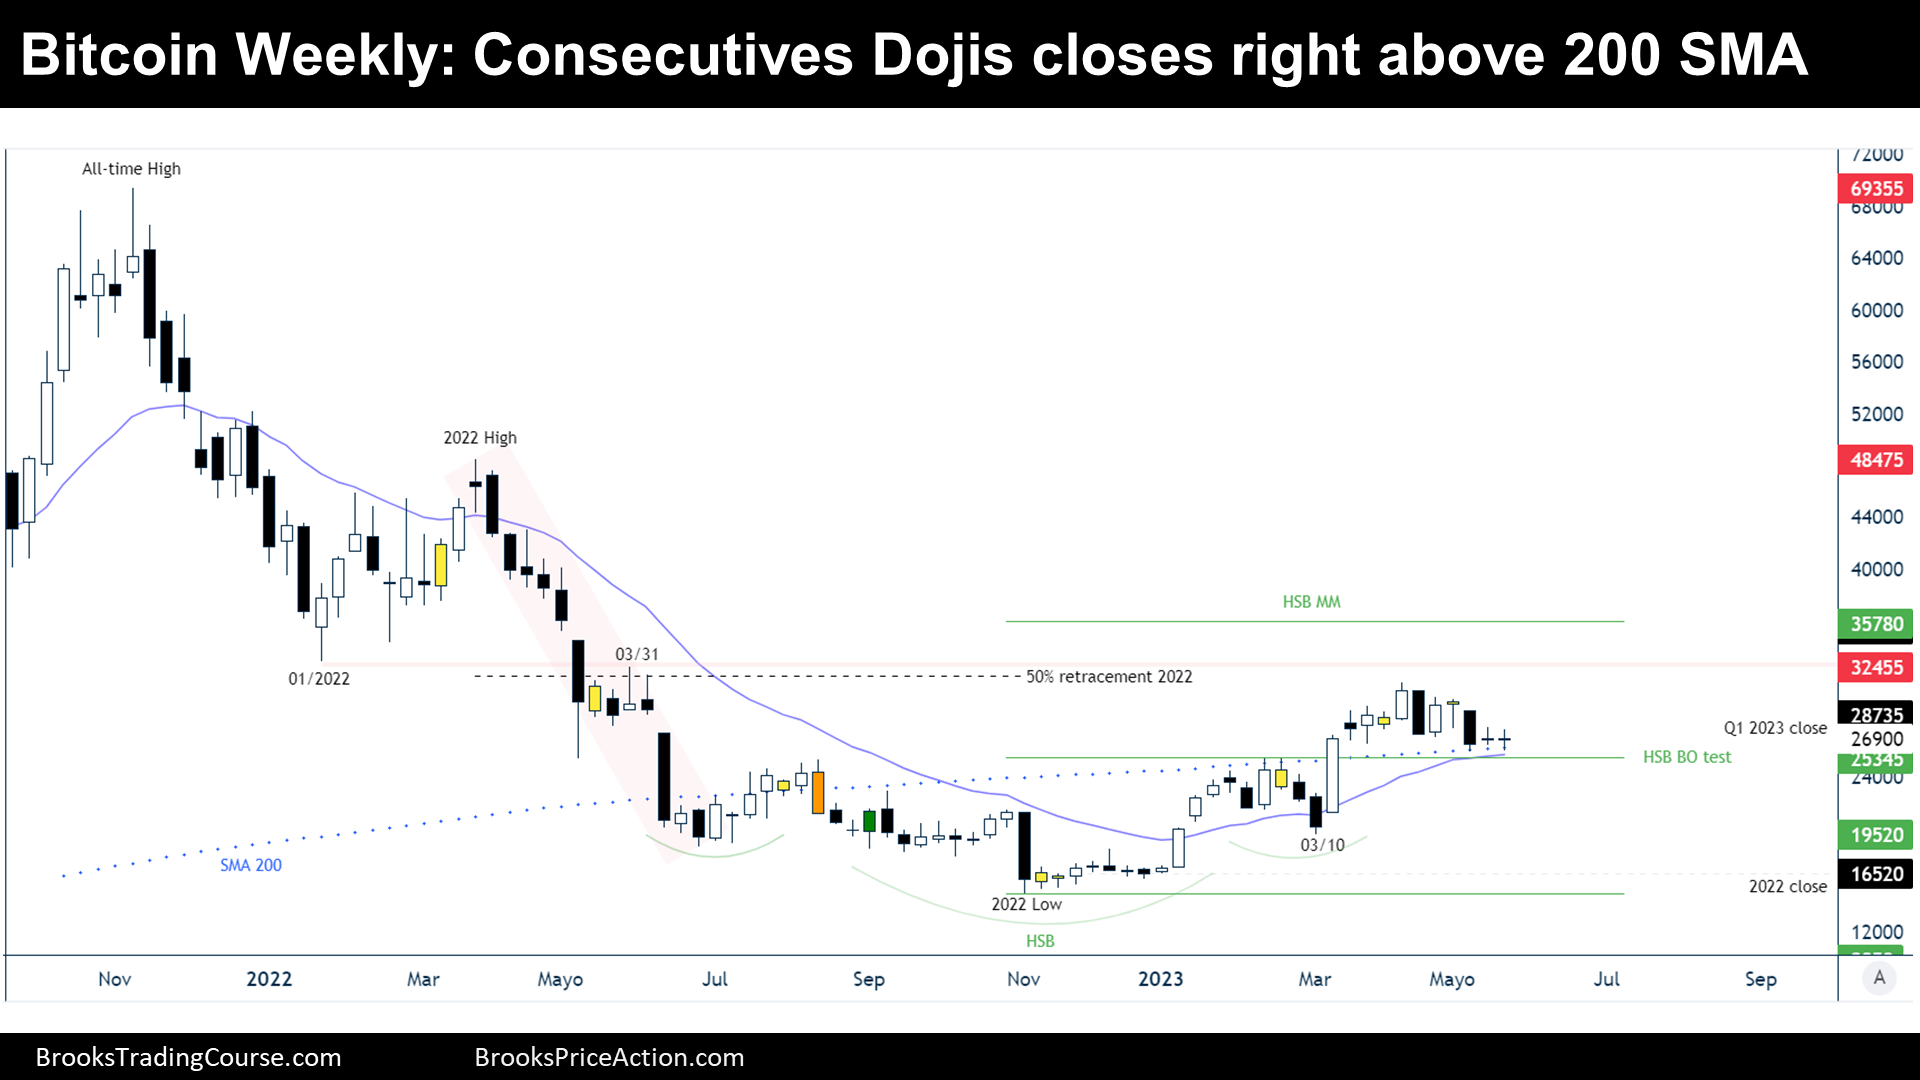
Bitcoin consecutive dojis at the 200-week Simple Moving Average (SMA). The price barely increased its value by 0.13% during the week. Bitcoin is testing a Head and Shoulders Bottom (HSB) breakout point, which is right below the 200-week SMA and the 20-week Exponential Moving Average (EMA). Traders still wonder if the bulls will resume their trend towards the HSB Measured Move (MM), or if this is the start of a bear leg evolving within a trading range. During the next week, there is the Monthly candlestick close; so far, the price is currently trading right below the April low, which could be a price magnet during the week.
Bitcoin futures
The Weekly chart of Bitcoin futures

Analysis
- This week’s candlestick is a doji bar. It is a consecutive doji after a bear breakout bar that was testing the HSB Breakout Point.
- Traders still wonder if the bulls will resume their trend towards the HSB Measured MM, or if this is the start of a bear leg evolving within a trading range.
- With this consecutive doji, there is a micro double bottom above the 200-week SMA.
- This micro double bottom favors bulls since the price stays within a bull channel.
- The bull channel was not strong at the beginning because there was a deep retracement and a many gaps closed during the first leg up, created within the first quarter of the year (Q1).
- When the channels have deep pullbacks, (more than 30% retracements), the price is usually within a broad channel instead of a small pullback trend.
- The difference between a broad channel and a small pullback trend is that broad channels are, more often than not, legs in trading ranges, and small pullback trends, are trends.
- Trends tend to break supports and resistances.
- Trading Ranges tend to reverse at supports and resistances.
- Traders wonder if this is Trading Range price action or if this is a Trend.
- If Bitcoin closes the gap between the price and the HSB breakout point, before there is a new high, the market cycle will be probably a Trading Range. If it keeps the gap open and achieves fresh highs of the channel, the market cycle may be a Trend.
- 2022 picture was a tight bear channel, or a bear spike and channel.
- Nowadays, the price still within the 2022’s price range.
- The major lower high on the monthly timeframe is the 2022’s high.
- The 50% retracement of 2022’s drawdown is right above the current bull channel high.
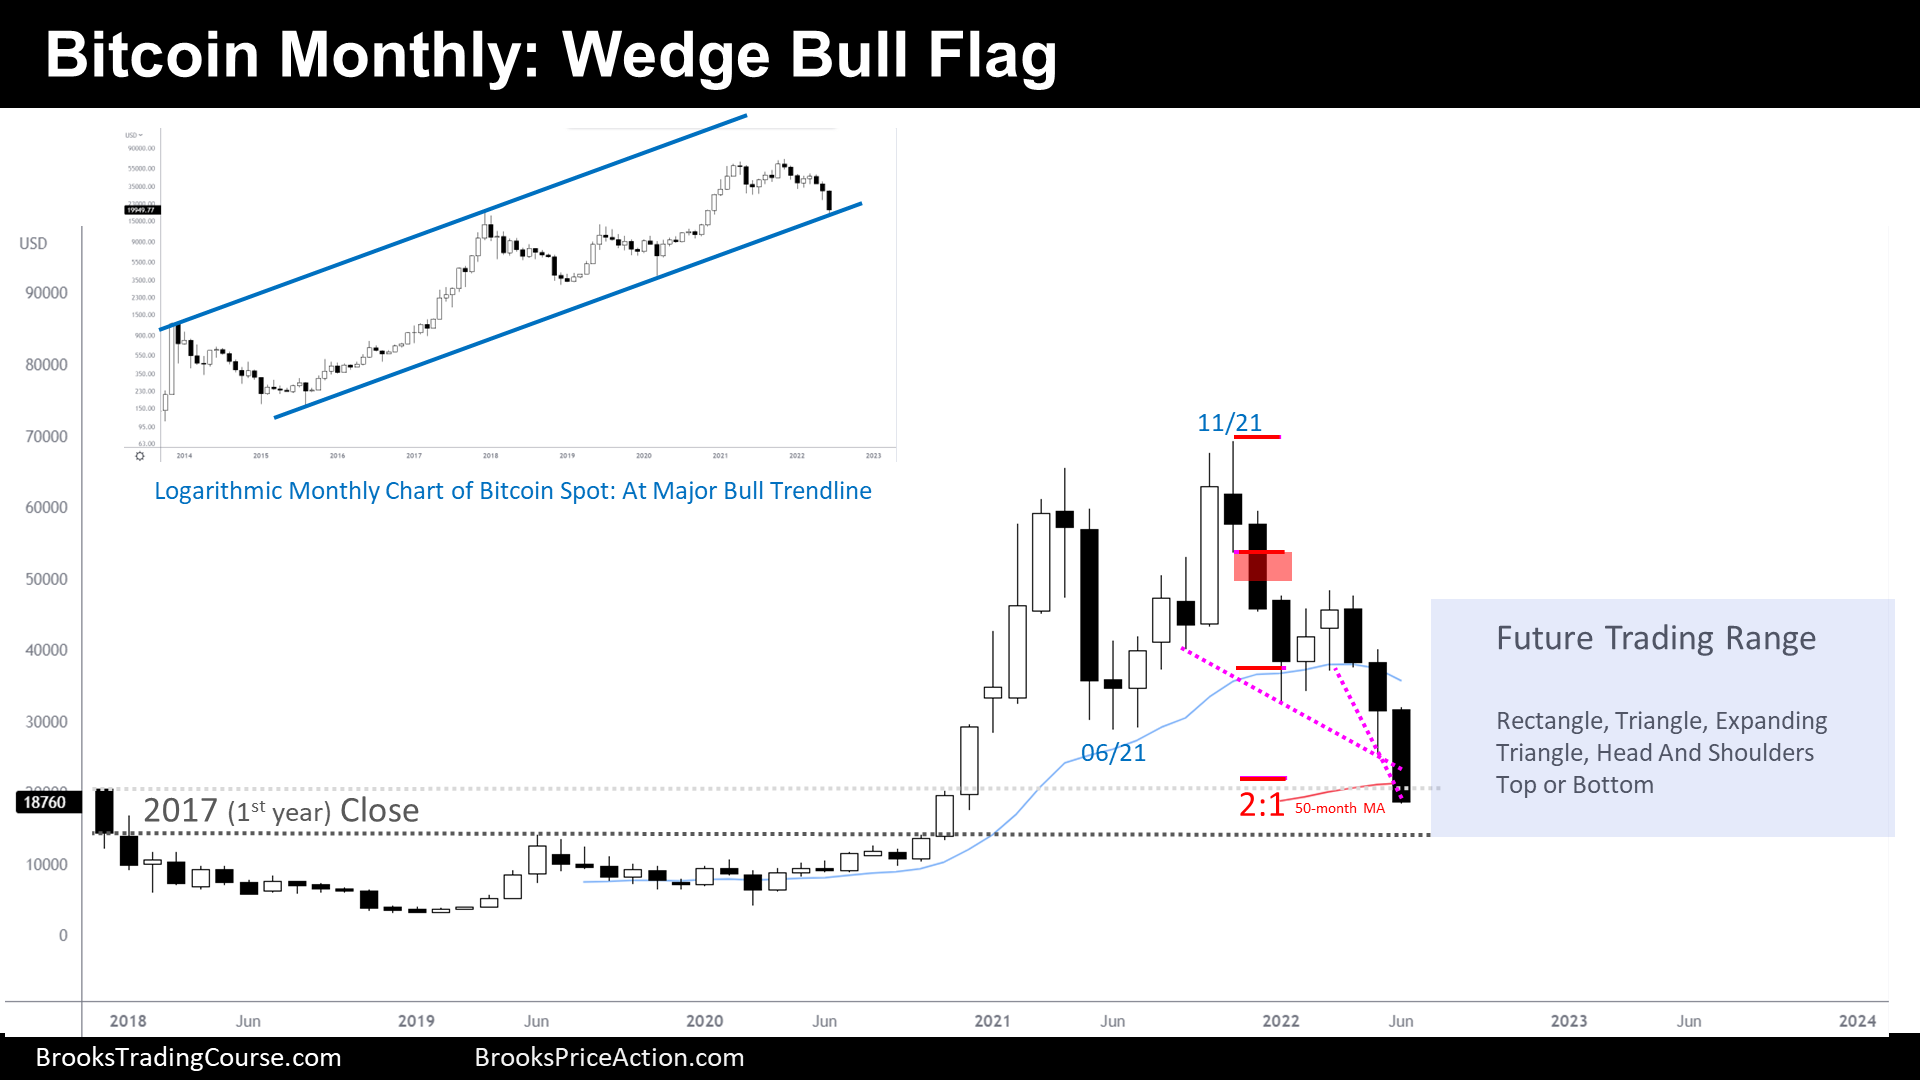
- Almost a year ago, within the Bitcoin’s July 3rd report (see chart below), we have said that the price should create a trading range pattern between $15000 and $45000 at least until 2024. This remains true.

Monthly chart of Bitcoin Futures report chart on July 3rd 2022
- Coming back to our time, this is how it might be the different market participants’ perspective:
- Bulls:
- They think that the HSB pattern will be followed by a major bull trend reversal.
- At a minimum, they want to get to the major lower high at the March 31st high to end, technically, the bear trend.
- The problem is that many bulls were trapped into longs during the way down, and that means selling pressure along the way.
- There were probably trapped bulls at the June 2021 low (price is below it nowadays), and there will likely be trapped bulls at the January 2022 low.
- Bears:
- They think that this bull channel is just a leg in a Trading Range, and that eventually the price will test the major higher low of March 10th.
- Then, a resumption of the bear trend.
- More likely than not, there will be a bear leg starting at some point during this year.
- However, the downside is limited since the bulls broke above a higher high, and created a higher low that it is above the 2022 low.
- Bulls:
Trading
- Bitcoin consecutive dojis are not a good setup for bulls, neither for bears.
- Bulls:
- Some have bought at the 200-week SMA with a Stop Loss at the major higher low and a target at the HSB MM. This trade Risk 1 : Rewards 1.5, so it needs at least around 50% probability of success. I think that while the price is above supports, the moving averages and above the HSB breakout point (supports), the math is ok. If the price moves down, I think traders should not let their stop being hit, since a breakdown of supports invalidates this trade.
- Bears:
- They want either:
- A reversal from double top with April’s high.
- A bear breakout of supports.
- They want either:
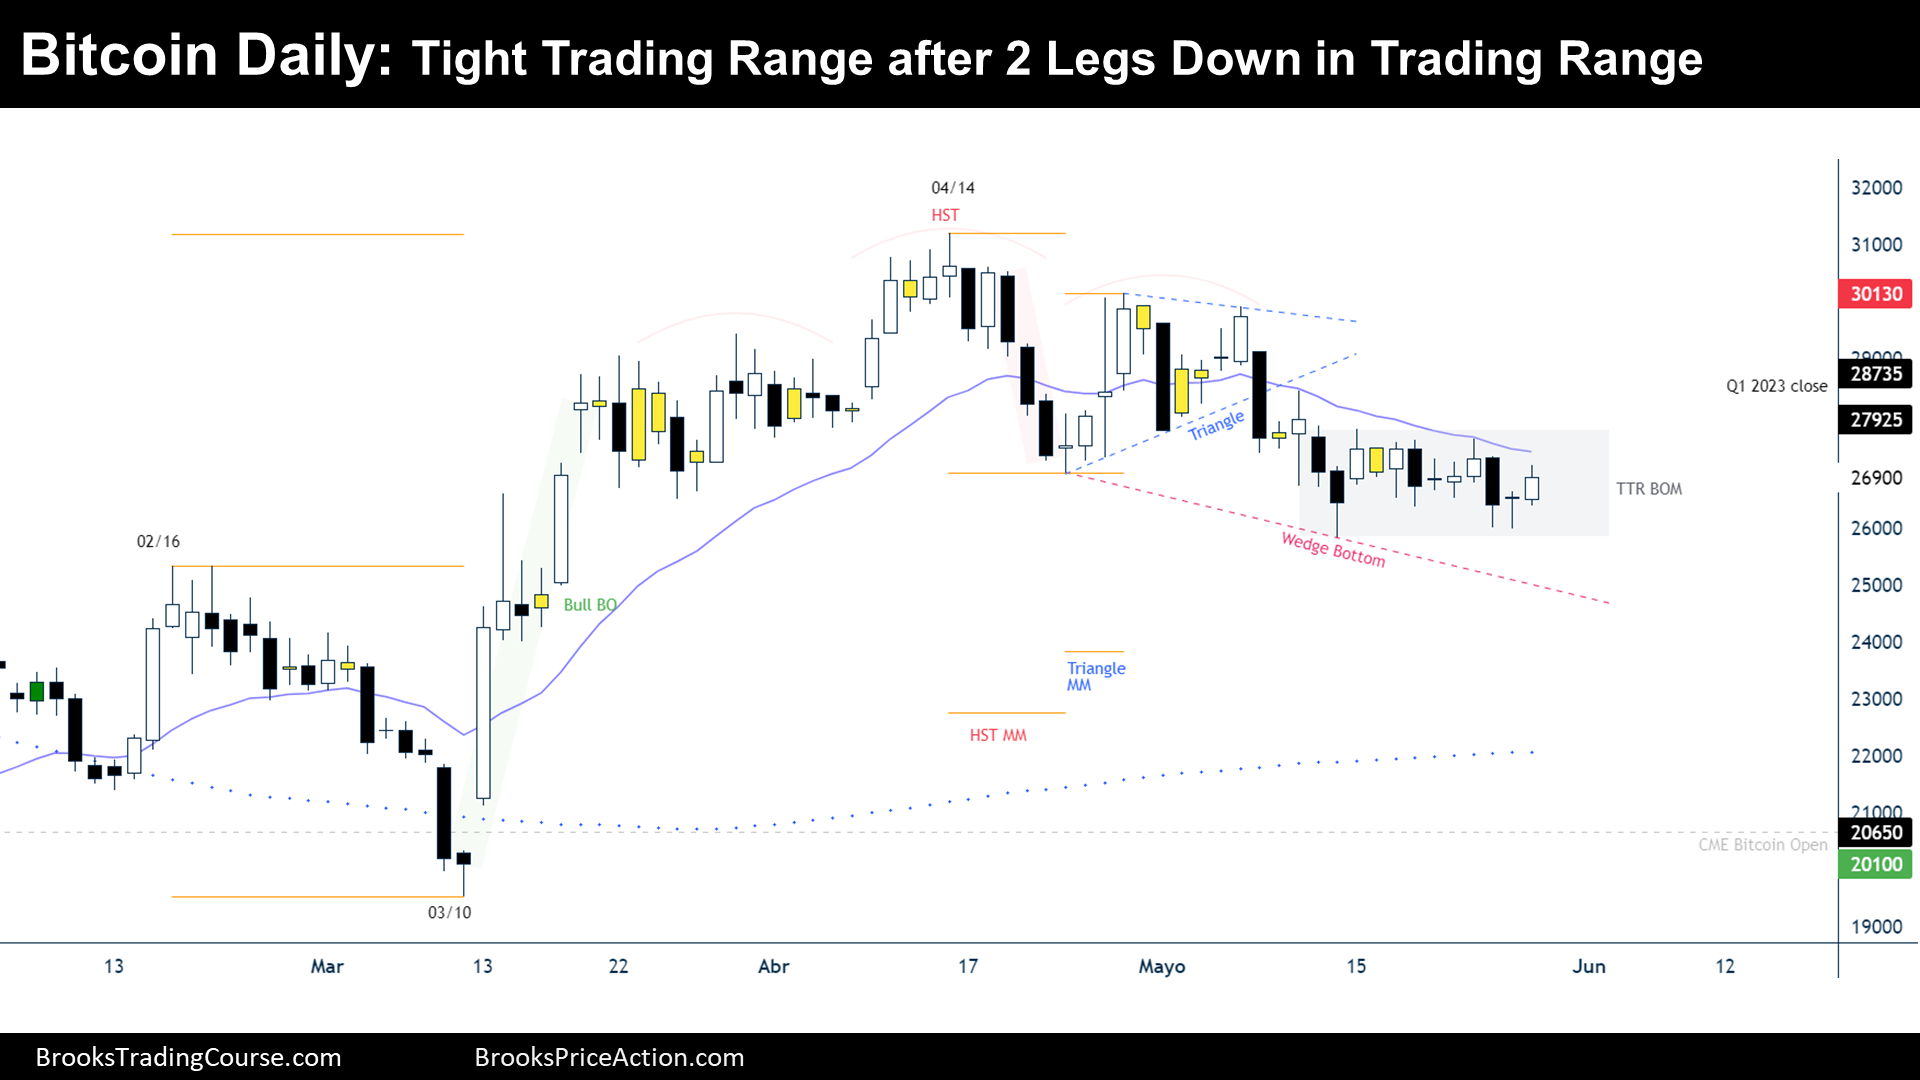
The Daily chart of Bitcoin futures

Analysis
- During the week, the price reversed down from the 20-day EMA, but there was no bear follow through at the end of the week.
- The price has been within a Tight Trading Range for a couple of weeks. This means 10 bars sideways.
- Before the Tight Trading Range, we were seeing:
- A Head and Shoulders Top (HST).
- A Bear Breakout in a Spike and then Channel (channel starting at the right shoulder of the HST).
- A Triangle (right shoulder of HST).
- There was a bear breakout of all of them, but a Tight Trading Range is what followed.
- Tight Trading Ranges reflect equilibrium. Moreover, it is a Breakout Mode Pattern (BOM), so there is a 50% chance that it will break on either side.
- BOM patterns usually need to follow trends, to create good swings on one side or the other, but this BOM is not following a trend.
- This BOM is following the typical 2 legged move, that normally occurs within Trading Ranges.
- The more the price goes sideways, the less attention traders pay to prior patterns. 10 bars sideways might be enough time to realize that the bearish inertia of the bearish patterns is over.
- Meanwhile, there are no visible breakouts on one side or the other, the best that traders might do is to look at this HST pattern and what followed, simply as a Trading Range.
- Occasionally, a 2-legged move in a Trading Range evolves into a 3-legged move (or a complex 2-legged move in a Trading Range). If this happens, it could create a wedge bottom pattern.
- But even if this is surely a Trading Range, traders do not know where the low is. They agree that the top is the HST high. But the bottom might be at a MM down from the HST pattern, which would be around the 200-day SMA.
- The market participants’ perspective could be something like this:
- Bulls:
- They see a double bottom and want a Follow Through of the Friday’s bull bar. If they get good follow through, they will expect a bull breakout of the BOM pattern and a test of right shoulder’s high.
- If bears break below the BOM pattern, they will see this Tight Trading Range as a final flag of a bear spike and channel, and hence, they will expect a bull reversal from the final flag. That would create a wedge bottom pattern, and therefore, they will see a good trader’s equation.
- Bears:
- They know that the prior bearish patterns are not looking strong nowadays, while the price is sideways. But they want the bear channel to continue and achieve the HST MM down.
- Bulls:
Trading
- Both, bulls and bears, need consecutive bars on their side before betting for a swing.
Market analysis reports archive
You can access all weekend reports on the Market Analysis page.


Thank you, Josep!