Al added a few comments to report
Market Overview: Weekend Market Analysis
The SP500 Emini futures are in the middle of 7-week trading range with 2 weeks remaining in 2021. The probability is slightly higher for a new high before a test of the December low.
The EURUSD Forex market has been in a trading range for 4 weeks. However, Friday was a big bear candlestick closing near its low. That makes a bear breakout and a test of the June 19, 2020 low more likely than a reversal up.
EURUSD Forex market
The EURUSD weekly chart
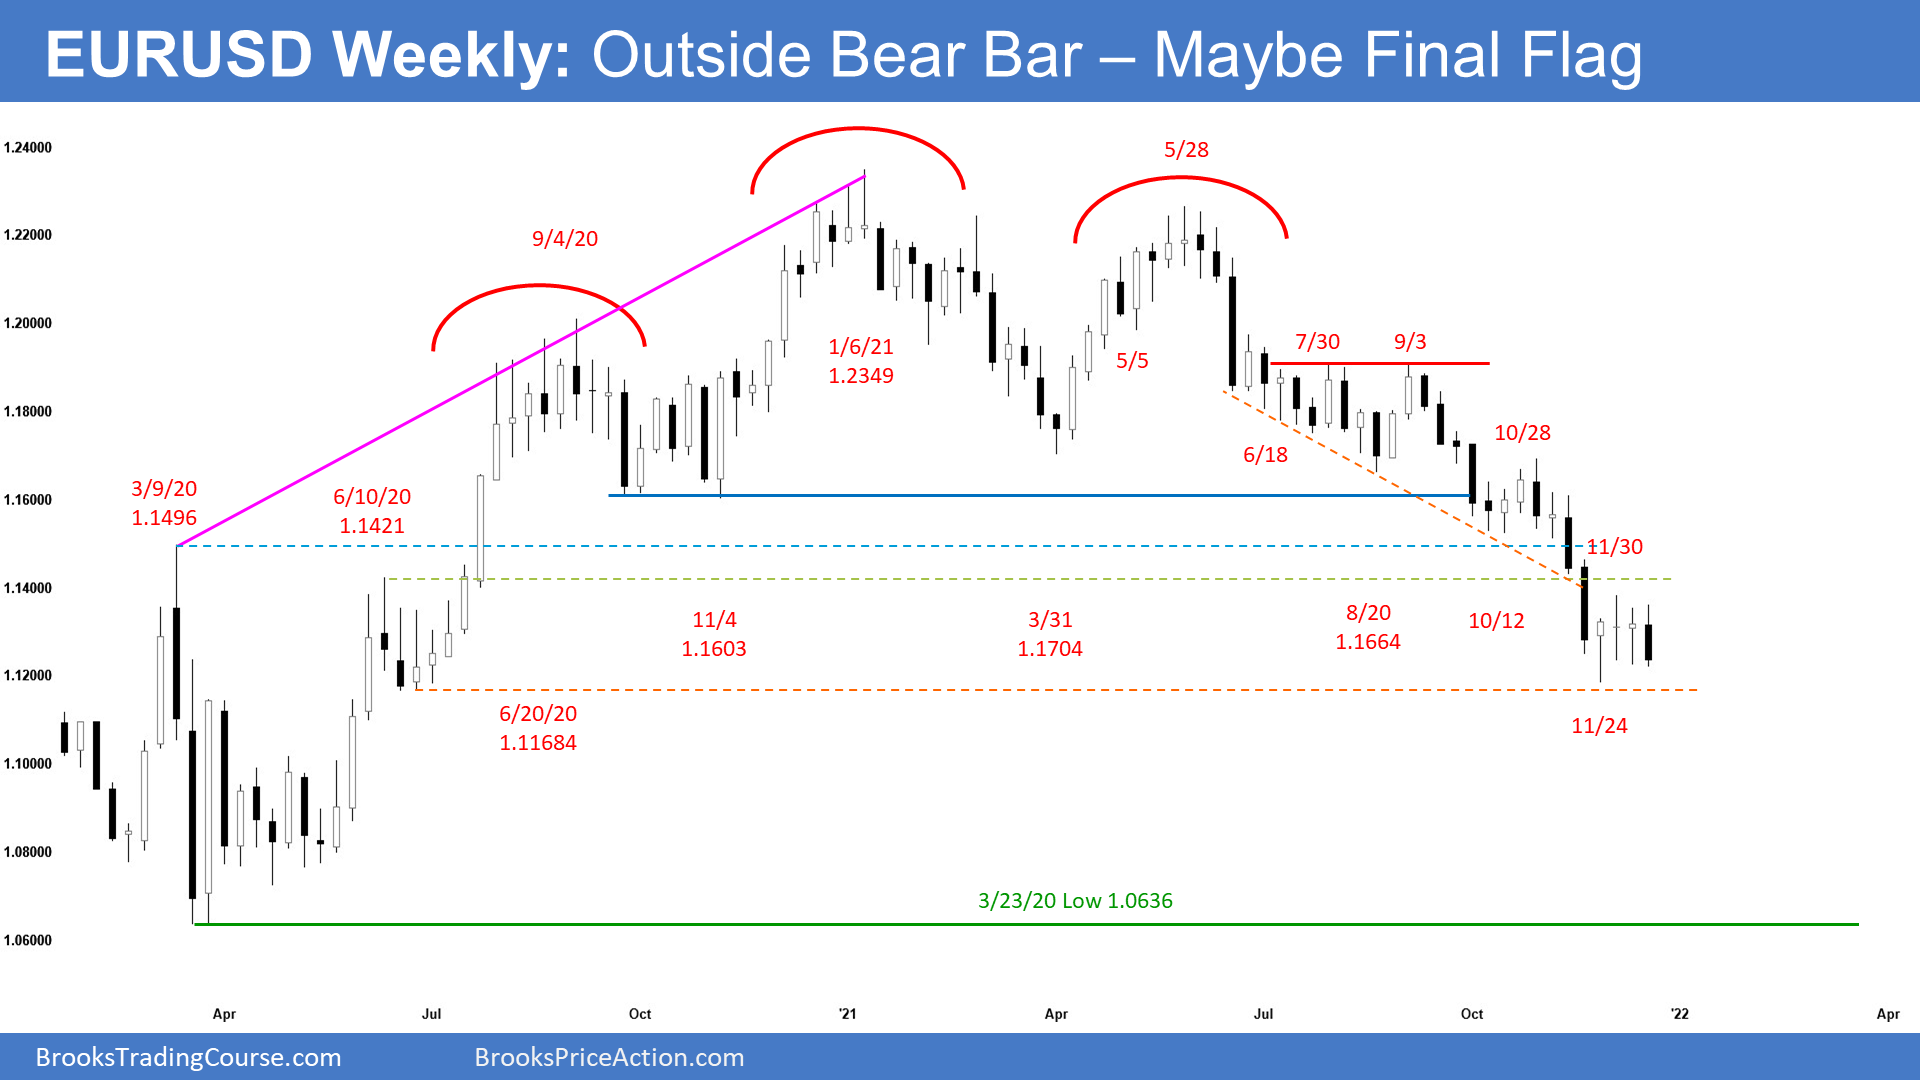
- This week’s candlestick on the weekly EURUSD Forex chart was an outside bear bar closing near the low. It also closed above last week’s low.
- This is the 4th consecutive sideways week on the weekly chart. The prior 3 weeks had small bodies.
- This week triggered a Low 2 sell signal by going below last week’s low. However, it followed 3 weeks of doji bars and reduces the chance that the EURUSD going far below it without another pullback.
- Since this week is a bear bar closing near the low, it is a strong bear entry bar. That increases the chance of at least slightly lower prices next week. It may test below the June 19th, 2020, higher low.
- The bears want a strong break below the June 19th, 2020, higher low and a continuation of the measured move down which began in October.
- For now, if there is a break below the 4-week trading range, odds are it might be the final flag of the bear leg.
- The bulls want next week to reverse up and become a buy signal bar. They want these four sideways bars to be a base after the two big bear bars in early November. They want those two bars to be an exhaustive end of the yearlong selloff.
- However, they need to get big bull bars closing on their highs and closing far above the top of the four-week tight trading range before traders will conclude that a bull trend has begun.
- Al has been saying for a few weeks that there should be a sideways to up move lasting at least a couple of months starting from where the EURUSD is now or from slightly lower. The EURUSD is in the middle of a 7-year trading range. Legs rarely go straight from the top to the bottom without some confusion, which is a hallmark of a trading range. This year has been clearly bearish. Clarity does not last forever in trading ranges.
- Al has also said that currencies have an increased chance of reversing in early January. The current bear trend began on January 6th of this year. The bears hope that the yearlong bear trend is a resumption of the bear trend that began in 2008. More likely, the seven-year trading range will continue.
- The 2021 selloff is still more likely a pullback from the 2020 rally than a resumption of the bear trend that began 14 years ago.
- A couple of months of sideways to up trading is likely before there is a breakout below the bottom of the 7-year range, if there is going to be a breakout below the bottom before a breakout above the top.
- There is only a 30% chance that this selloff will continue down with only brief pullbacks and then break strongly below the 7-year trading range.
The EURUSD daily chart
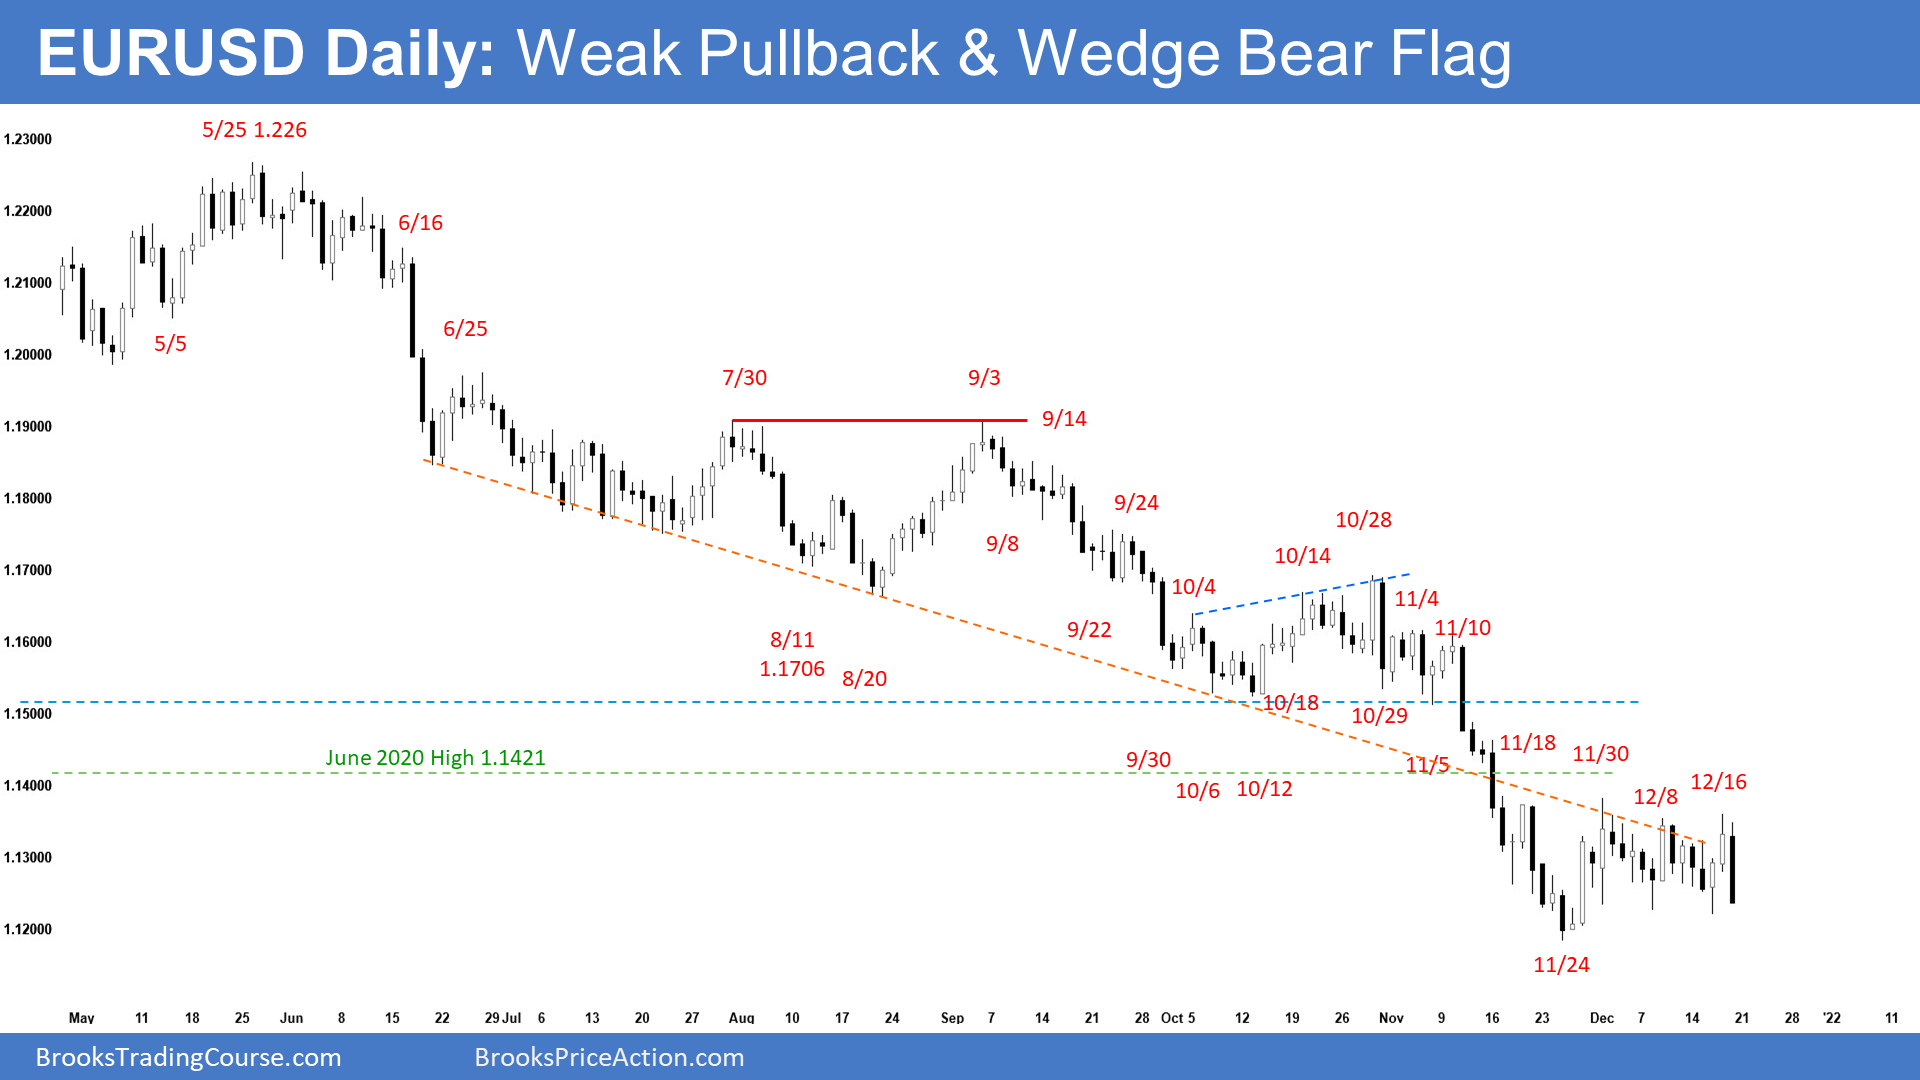
- The daily chart has been in a very tight trading range for a month. Every trading range has double tops and double bottoms. It is a breakout mode situation.
- That means there is about 50% chance of a successful bull breakout and a 50% chance of a successful bear breakout.
- It also means that there’s a 50% chance that the first breakout up or down will fail and reverse.
- Because the tight trading range is coming in a bear trend, even though the market is in breakout mode, it’s slightly more likely that there will be a bear breakout. This is especially true with this week closing near its low.
- The bears see the tight trading range as a wedge bear flag (November 18, November 30 and December 16 or November 30, December 8 and December 16) and want a continuation of the measured move lower.
- They see the move down from November 10 to November 24 low as the first leg down and want a breakout from the wedge bear flag to form a second sideways to down leg.
- However, the tight trading range may be the final bear flag followed by a reversal up probably from around June 19th, 2020, low and around early January.
- Al has been saying that because the EURUSD has been in a trading range for 7 years, the odds of more reversals are greater than those of a breakout of the 7-year range.
- The current leg down has lasted a year. While it could last longer, it will probably reverse up for at least a couple of months before breaking below last year’s low and the 2017 low at the bottom of the 7-year range.
- There’s only a 30% chance that the small pullback bear trend will continue down to last year’s low without at least a rally lasting a couple of months or more.
S&P500 Emini futures
The Monthly Emini chart
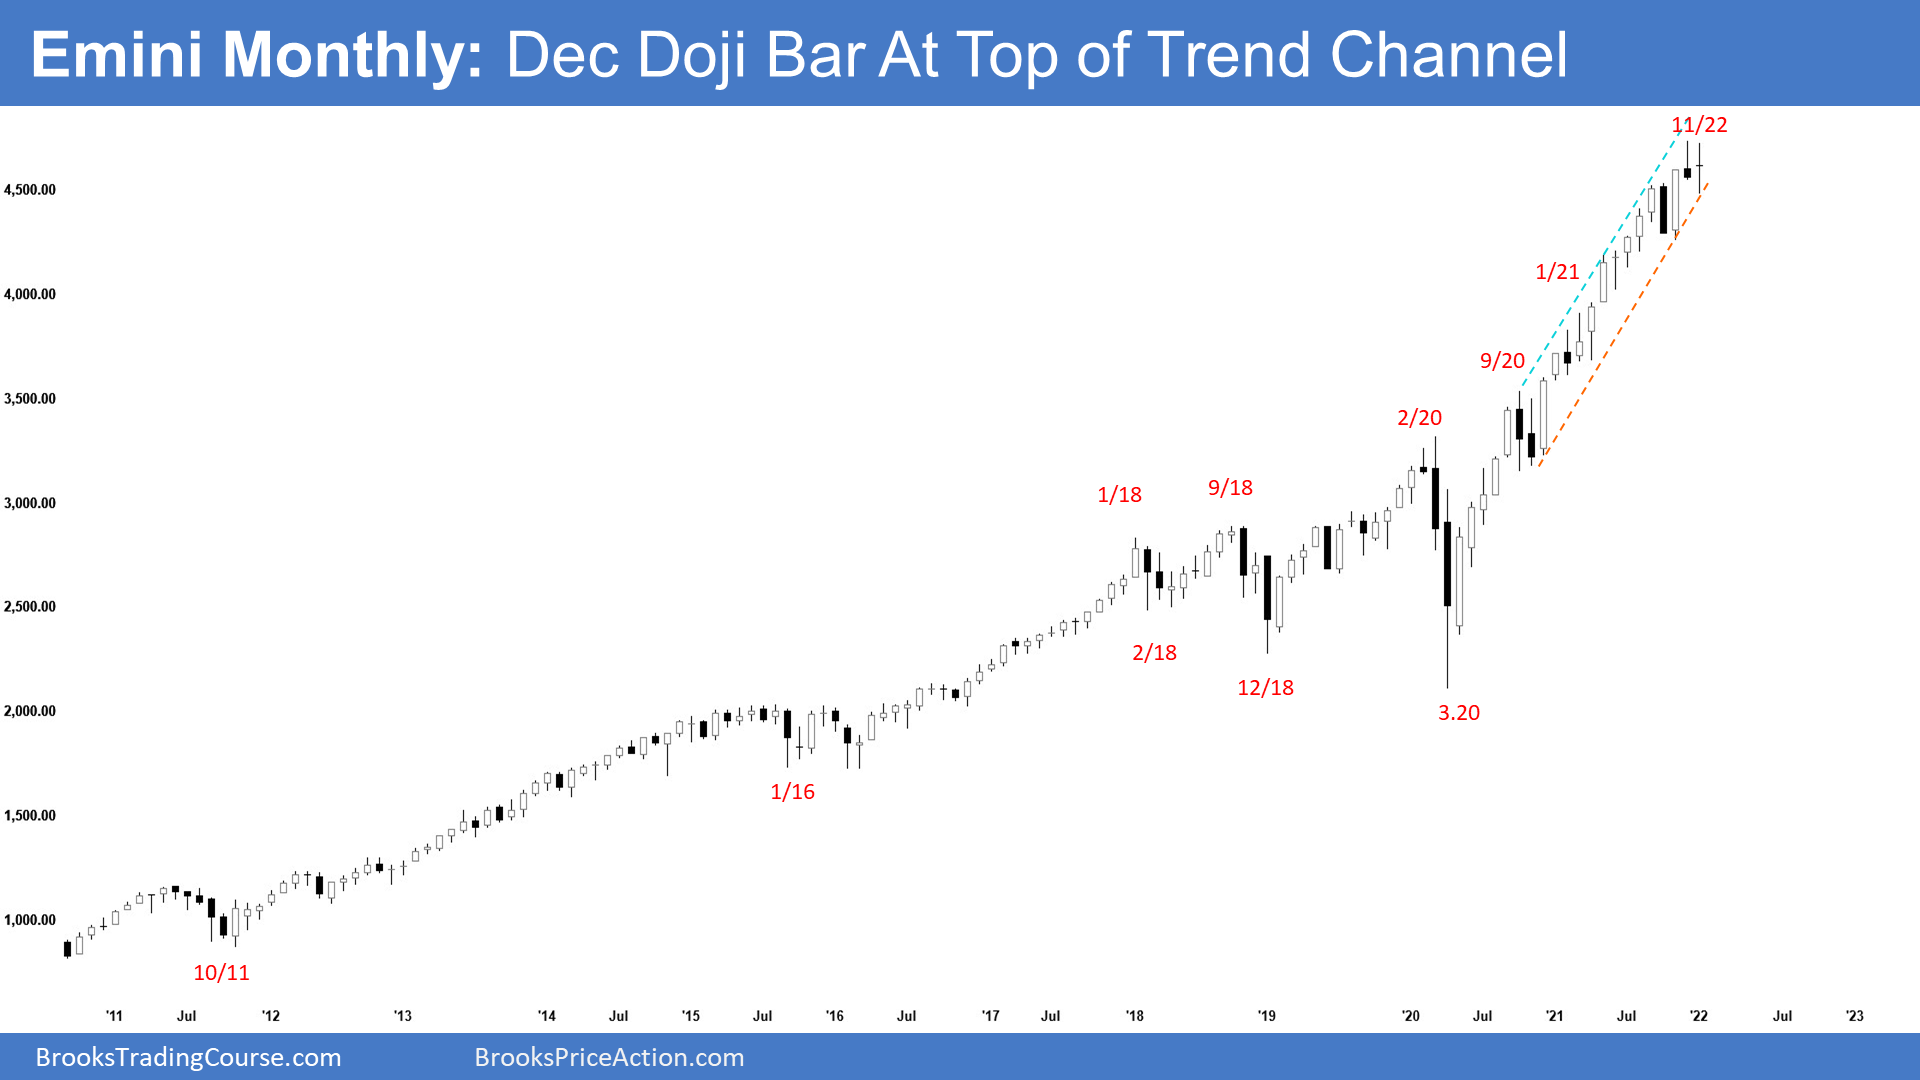
- The December monthly Emini candlestick currently is a doji bar. When December went below the November low, it triggered a Low 1 to sell signal. That sell signal is in effect unless the market goes above the November high.
- With the bull trend as strong as it has been, and with December not selling off sharply and far below the November low, the bulls have at least a 50% chance that the market will not continue down, without first going above the November high.
- It could go above the November high in December or in January.
- If it goes above the November high in December, December will be an outside up month, like we had in October.
- However, it would be the third leg up where the first legs up were August and October. Therefore, a reversal down after a new high would be from a micro wedge. That would probably lead to a couple of bars sideways to down. The target would be the bottom of the outside bar in October.
- Remember there was an OO buy signal when November went above the October high. November was a bear bar and therefore a sell signal for a failed breakout above the OO pattern. However, there has not been follow-through selling in December.
- There is still time for December to close on its low and far below the November low. There is also time for December to close above the November high and form an outside up month.
- With December currently in the middle of the month’s range and around the open of the month, traders have not yet decided what to do with the close of the month.
- If the close remains around the open, that increases the chances of more sideways trading in January.
- The odds continue to slightly favor a new all-time high in December or January.
- However, there will also probably be a reversal down either starting in December or in January.
- Because the bull trend is so strong, if there is a reversal down, it probably will be minor, which means it’ll probably last a month or two and not continue straight down into a bear trend.
The Weekly S&P500 Emini futures chart
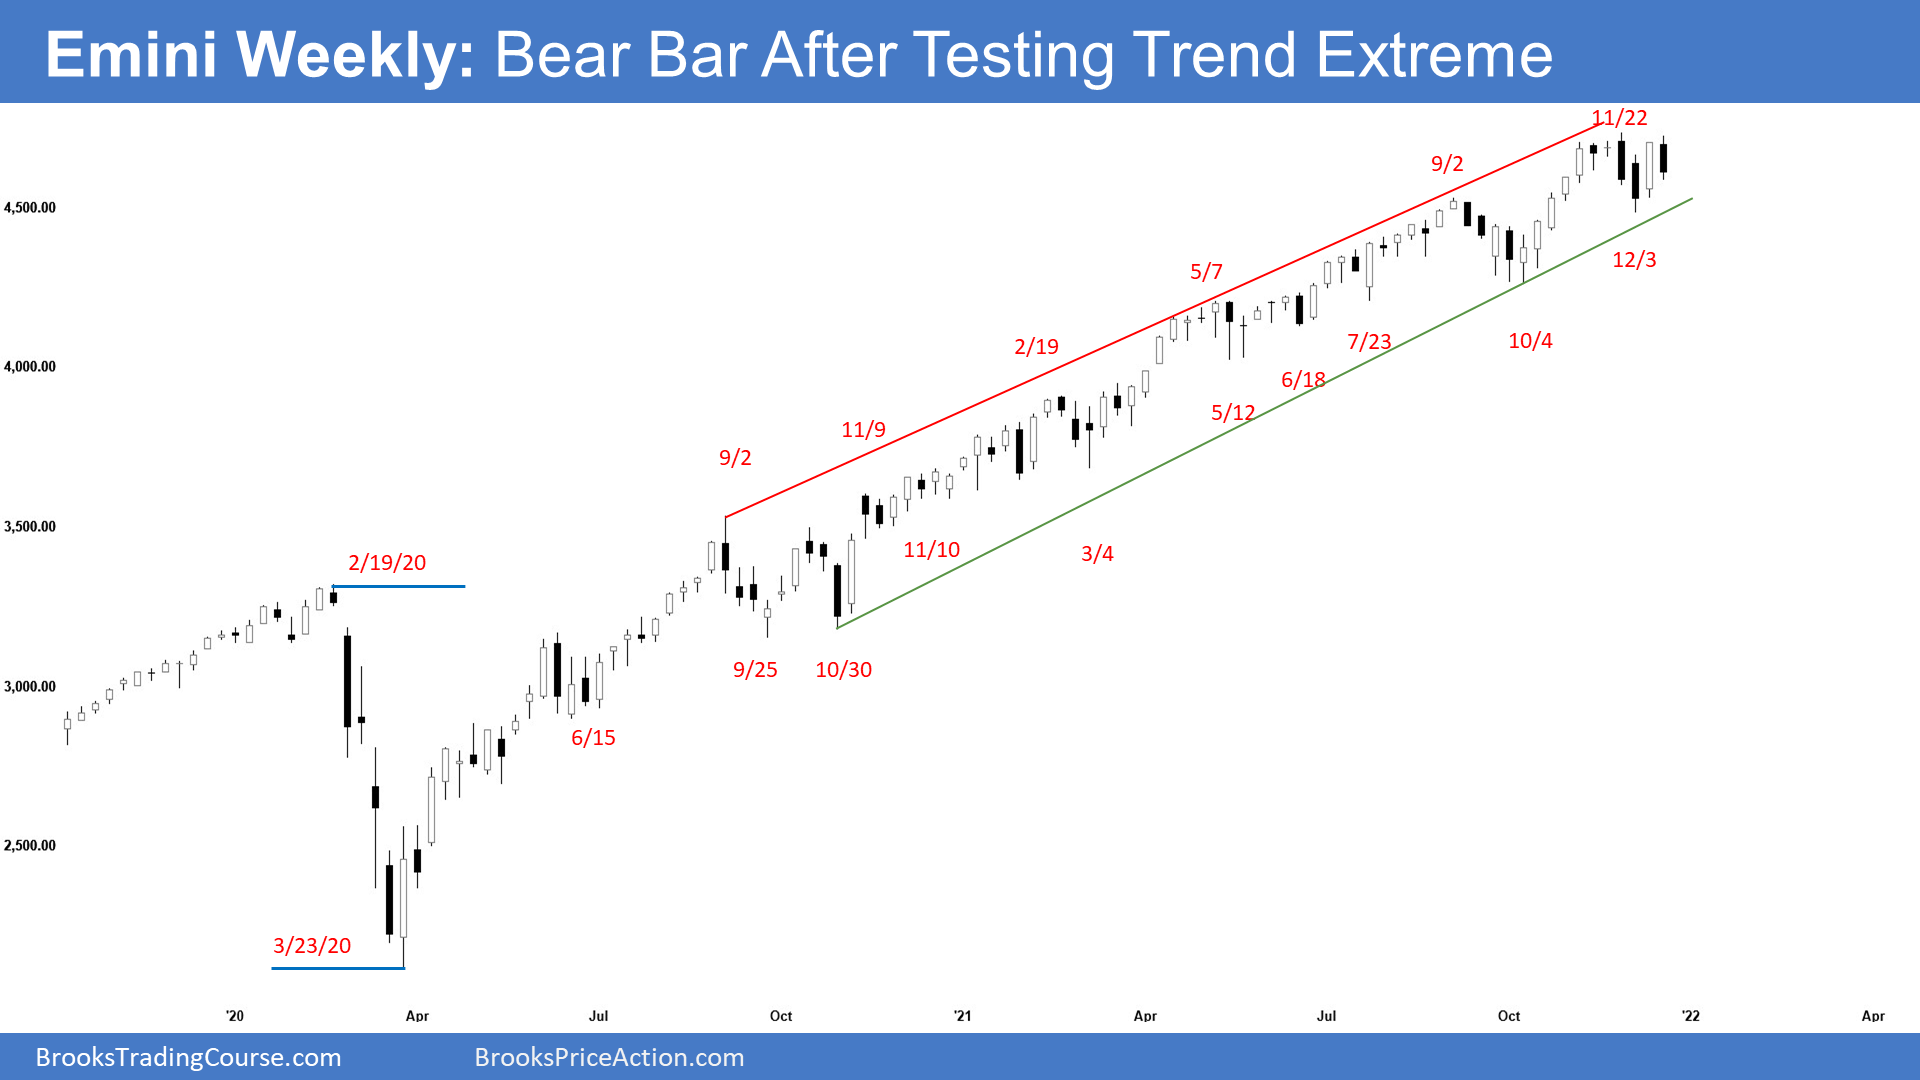
- The Emini is in the middle of a 7-week trading range with 2 weeks remaining in 2021.
- This week’s Emini weekly candlestick was a bear bar closing near the low after trading above last week’s high.
- The Emini is in middle of 7-week trading range with 2 weeks to end 2021.
- It is a sell signal bar for a small double top with the November 22 high. However, since the bull trend is strong and the Emini has been in a tight trading range for 7 weeks, it is a less reliable sell setup. The bears will need to create follow-through selling next week to convince traders that a deeper pullback may be developing.
- Al said that last week’s bull bar followed two consecutive bear bars which reduce the chance of the Emini going far above it without another pullback. This week was another pullback.
- Next week will probably have to go below this week’s low to see if there are more sellers there. If next week is also a big bear bar, there would be a 50% chance that the selloff would continue down to the October low before the bulls get a new high.
- If next week is a bull bar closing above its midpoint, the bulls will try to get a new all-time high in the final week of the year.
- Traders might be waiting for the final week of the year before they decide whether the year will close at a new all-time high or close near the December low.
- The Emini has been sideways for seven weeks. That is a tight trading range and a breakout mode pattern. Because it’s in a bull trend, a bull breakout is slightly more likely than a bear breakout, even if next week breaks a little below this week’s low.
- However, a tight trading range late in a bull trend is usually a final bull flag. Therefore, if the market does go up over the next several weeks, it probably will not go up very far before there is a reversal down to the bottom of the bull flag, which is the December low.
- Al has said that the Emini has been in a strong bull trend since the pandemic crash. There have been a few times when the bears got the probability of a correction up to 50%, but never more. The probability of higher prices has been between 50 and 60% during this entire bull trend. It has never been below 50%. That continues to be true.
- The strong selloffs, like in September in 2020 and again in 2021, pushed the probability for the bears up to 50%. But every prior reversal has failed, and the bears never had better than a 50% chance of a trend reversal.
- The odds favor more sideways trading next week.
The Daily S&P500 Emini futures chart
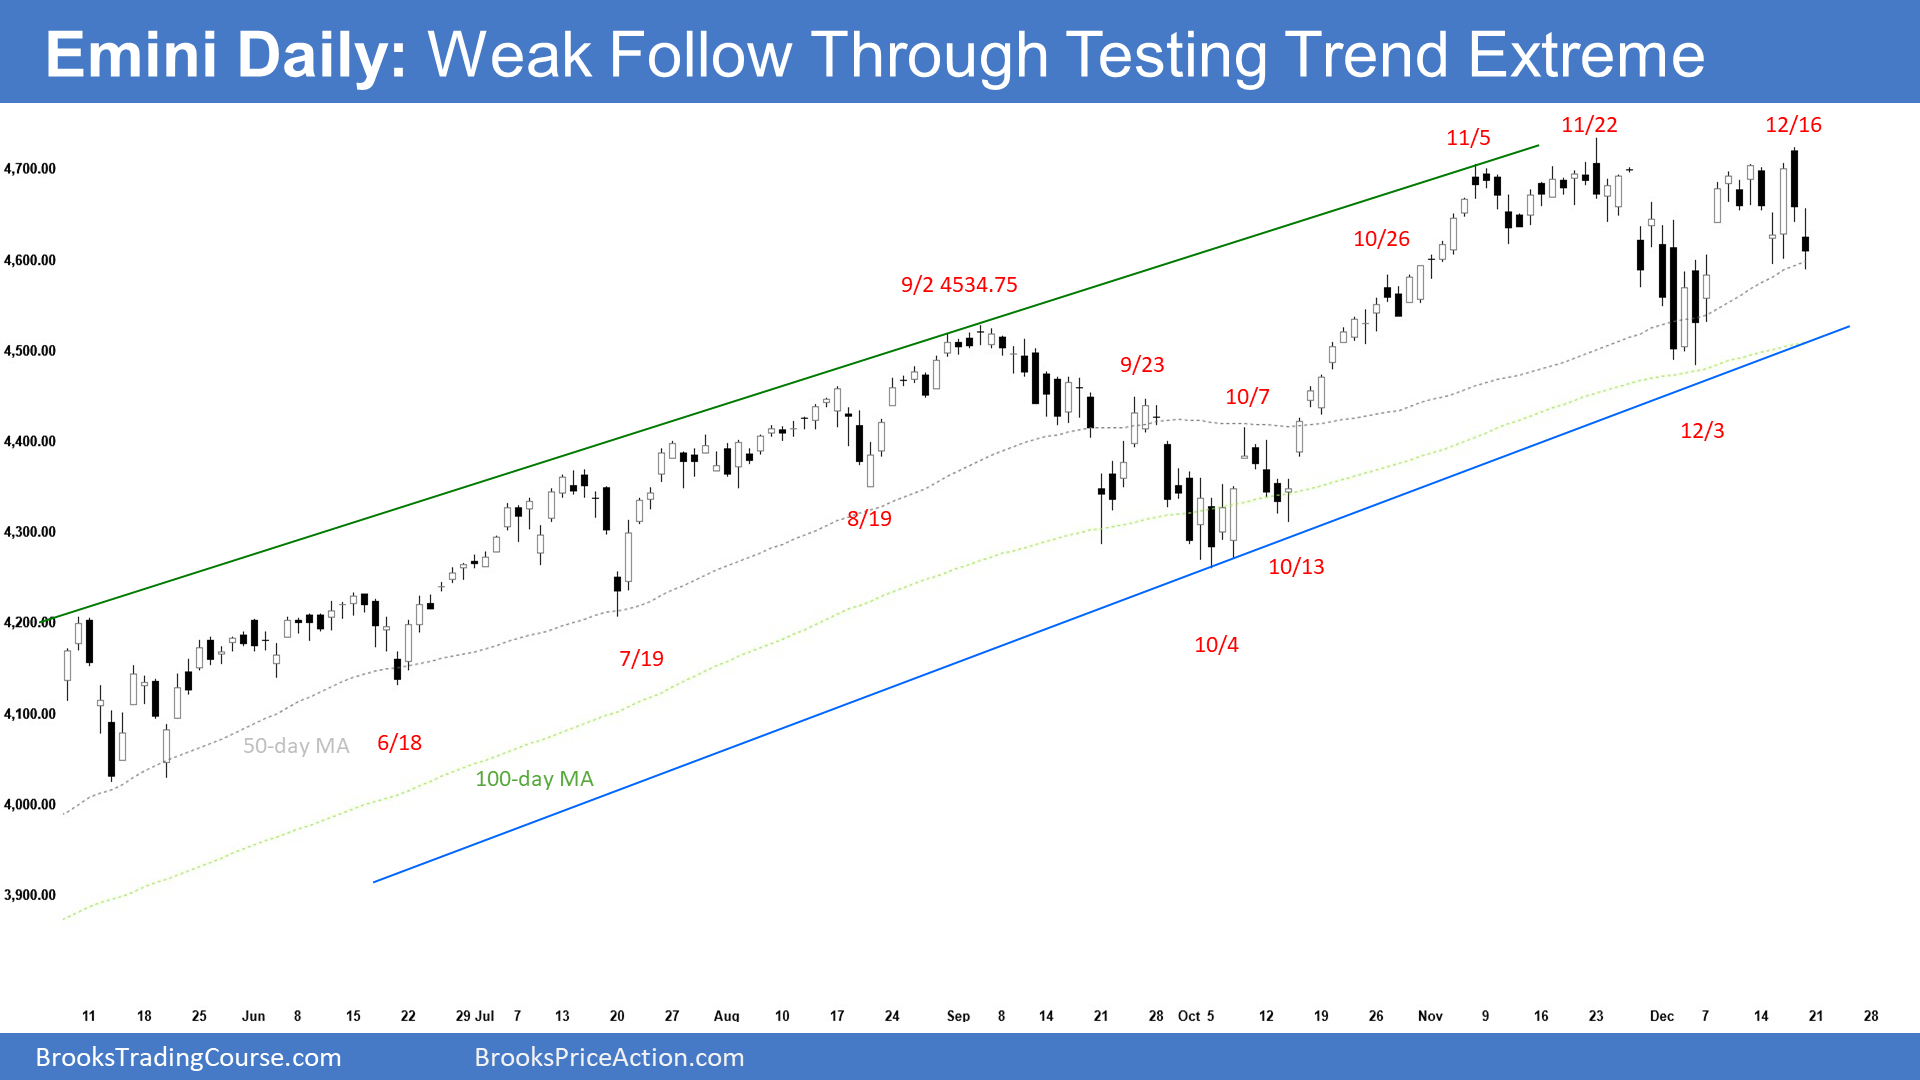
- The Emini traded sideways to down for the week. Friday was a bear doji candlestick.
- The bulls want a reversal up from a double bottom with Tuesday’s low at the 50-day moving average. The low is also about a 50% retracement of the December rally.
- The bulls want the bull trend to resume and for December to close at a new all-time high. That would be above the November high, and it would turn December into an outside up bar on the monthly chart.
- The bears, however, are hoping that Thursday’s big sell-off formed a double top with last Friday’s high and a bigger double top with the November 22nd all-time high.
- So far, the follow-through selling after Thursday’s big bear day has not been strong.
- What happens over the next week will determine what the market will do into the end of the year.
- If the bulls start to get bull bars, the rally will probably continue up to a new all-time high and above 4800.
- If the market forms bear bars, the selloff will probably test the December low by the end of the month. If it does, December will be a bear bar on the monthly chart, and that would increase the chances of January trading lower.
- The December rally is the third leg up. The first leg up began in October, the second leg up began on December 3rd.
- This will probably result in profit-taking and a test of the October low at some point in the next several months.
- If the Emini fails to make a new high, then the reversal will be from a double top with the November 22nd high.
- If the Emini does make a new high and then reverses down in January, there would be a wedge top where the first leg up was September 2nd and the second leg up was November 22nd. Again, the target would be the October 4th low, which is the start of the wedge rally.
- With the market being sideways for a couple of weeks, traders have still not yet decided whether to continue up to a new all-time high or reverse down.
- But with the bull trend as strong as it has been, it is more likely that the bulls will succeed in getting a new high this year.
- If they do the market will probably go above 4800 by the end of the year.
Trading Room
Traders can see the end of the day bar-by-bar price action report by signing up for free at BrooksPriceAction.com. I talk about the detailed Emini price action real-time throughout the day in the BrooksPriceAction.com trading room. We offer a 2 day free trial.
Weekly Reports Archive
You can access all weekly reports on the Market Analysis page.
Thanks Al for the update. I always appreciate your work!
On another note. I wanted to reach out to the community and see if there are any traders here in Colorado?
Thanks – Daniel
It looks like the daily Emini had a second entry short when Friday went below Thursday and has a second entry short setup on the weekly if it drops below the Friday low.
Thanks for the great report as always!
How likely we are formimg on the daily chart an HSB pattern wherebuy November 22nd and December 16th are the neckline area?
Hey Eli, Al did most of the heavy lifting this week. I’m always learning something new from him all the time.
Sorry, I didn’t get the HSB part. What pattern are you referring to?
Hey Andew, is okay – truly appreciate your efforts to keep us up to date.
HSB is head shoulder bottom. Al usually pays attention to those patterns from time to time.
The chart is in Breakout Mode. That means the probability is about 50-50. However, since the chart is in a bull trend and sold of violently a couple weeks ago and reversed up, the odds are slightly higher that there will be a bull breakout.
The market might react badly to the perception of a weak president after he failed today to get his signature proposal through Congress (President Manchin vetoed Senator’s Biden’s bill). We will find out Monday. The market instead might be relieved by not having to worry about the possible inflationary consequences of Biden’s plan. It might be happy that it failed. The next couple weeks could be big in either direction, or traders might continue to wait until January. A lot of tension.
Manchin needs Dem votes short Manchin