Trading Update: Tuesday February 11, 2025
S&P Emini market analysis
Emini daily chart
- The Emini is forming a triangle on the daily chart which is a breakout mode pattern. This makes the probabilities close to 50% for both the bulls and the bears.
- The odds may slightly favor the bulls because the higher time frame context. However, if one side had a big advantage, the market would not be going sideways in a tight trading range.
- The bears are hopeful that any breakout above the trading range will fail and lead to a major trend reversal.
- The bulls are hopeful that any reversal down will be minor and lead to trend resumption up.
- Overall, the market is in breakout mode which makes the directional probabilities neutral for a breakout up or down.
Emini 5-minute chart and what to expect today
- The Emini gapped down on the open and firmed a bull breakout with follow-through on bars 1-2. This increased the odds of a second leg up, which they got on the bar 7 report bar.
- Bar 7 is disappointing for the bulls and increases the odds of more sideways trading.
- The bulls formed an upside breakout with bar 12, crossing the moving average. Bar 12 is strong enough that the odds favored a 2nd leg up, which they got on bar 15.
- The bulls are hopeful that the breakout above bar 7 high, a strong enough breakout above the neckline of the double bottom (Bars 1 and 7), the bulls will get a measured move up.
Yesterday’s Emini setups
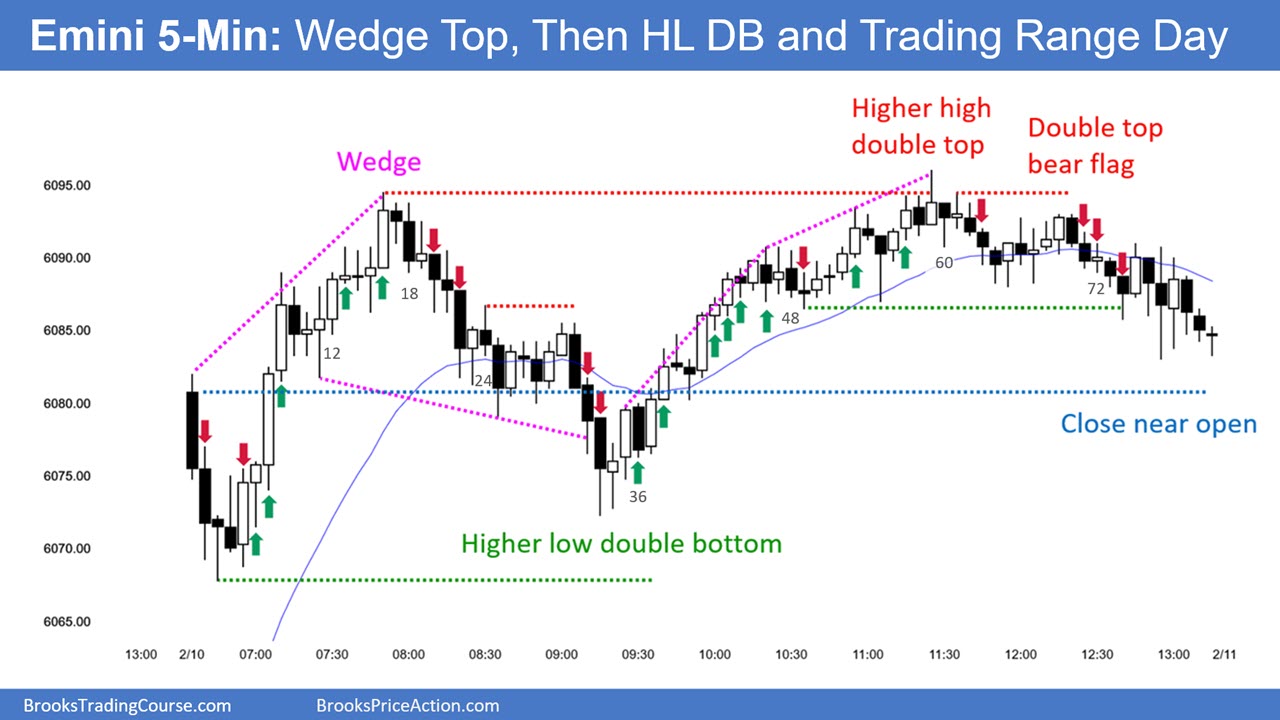
Al created the SP500 Emini charts.
Here are reasonable stop entry setups from yesterday. I show each buy entry bar with a green arrow and each sell entry bar with a red arrow. Buyers of both the Brooks Trading Course and Encyclopedia of Chart Patterns have access to a near 4-year library of more detailed explanations of swing trade setups (see Online Course/BTC Daily Setups). Encyclopedia members get current daily charts added to Encyclopedia.
My goal with these charts is to present an Always In perspective. If a trader was trying to be Always In or nearly Always In a position all day, and he was not currently in the market, these entries would be logical times for him to enter. These therefore are swing entries.
It is important to understand that most swing setups do not lead to swing trades. As soon as traders are disappointed, many exit. Those who exit prefer to get out with a small profit (scalp), but often have to exit with a small loss.
If the risk is too big for your account, you should wait for trades with less risk or trade an alternative market like the Micro Emini.
Summary of today’s S&P Emini price action

Al created the SP500 Emini charts.
Emini end of day video review
Periodic end of day review videos will be moved to top of page when done.
See the weekly update for a discussion of the price action on the weekly chart and for what to expect going into next week.
Trading Room
Al Brooks and other presenters talk about the detailed Emini price action real-time each day in the BrooksPriceAction.com trading room days. We offer a 2 day free trial.
Charts use Pacific Time
When times are mentioned, it is USA Pacific Time. The Emini day session charts begin at 6:30 am PT and end at 1:15 pm PT which is 15 minutes after the NYSE closes. You can read background information on the market reports on the Market Update page.


On the 2/11 chart a couple of my bars look different. For me the bear body on 6 is bigger and 11 closed above 10 high.
Also I pointed this out before but on 2/10 you marked 19 a sell entry but it’s an inside bar
11 closed BELOW 10 high on my chart I mean
My chart for 2/11 shows the same as Al’s above. I have full tick data and Al has sampled data, so Al’s bars are often a tick or so different in places. But this is the same for us both.
What data are you using? If sampled it should explain the difference.
Yes, 2/10 chart bar 19 markup was an error. I missed that. Have updated and replaced chart. Thanks.
Thanks for fixing.
I’m on Thinkorswim, and I checked with someone using Topstep who also saw 11 close below 10 high
Long bias the ES to test the 6150 level
is stop order selling during the day session dead?
Not sure what you are saying. All the sell setups above for today and yesterday are sell stop orders. Am I missing something?
50% probability of what happening? what kind of move?
Breakout mode so 50% chance of either a bull or a bear breakout.
Does this report still come out at 6:20 pacific time for
trading course members?
Sadly, Brad cannot get report done by 6:20 PT and often an hour or so after open. Working on getting back to pre-open release.
Okay thank you, that would be really great to read before open