Trading Update: Thursday February 17, 2022
Emini pre-open market analysis
Emini daily chart
- The Emini is in the middle of a 7-month trading range; therefore, it is neutral. There is a 50% probability of a bull breakout and a 50% probability of a bear breakout.
- There have been many reversals up and down that have been strong, making the market look confusing and disappointing. Those are the two main characteristics of a trading range.
- It is important to remember that every trading range has a reasonable buy and sell setup.
- The bulls have a double bottom with the January lows. The bears want any rally to form a double top and lead to a major trend reversal.
- As Al has mentioned several times, the monthly chart has consecutive outside bars (OO pattern), which makes the odds slightly more that the market has to fall below the January lows before going above the January high.
- Because last month’s bar on the monthly chart is so big, this month might be an inside month, and the breakout below or above the January high would be in March or April.
- Overall, it is best to assume the daily chart is neutral and expect more trading range price action.
Emini 5-minute chart and what to expect today
- Emini is down 20 points in the overnight Globex session.
- The Emini has been sideways and now is in the middle of the range created over the past 3 days.
- The market had several big swings overnight up and down, and each one led to a reversal.
- Traders will likely expect more trading range price action on the open and look to fade breakouts. Traders will look for a strong breakout with follow-through or a credible stop entry for a swing trade.
- If today is a trading range day, there should be at least one swing up and one swing trade down.
Yesterday’s Emini setups

Al created the SP500 Emini charts.
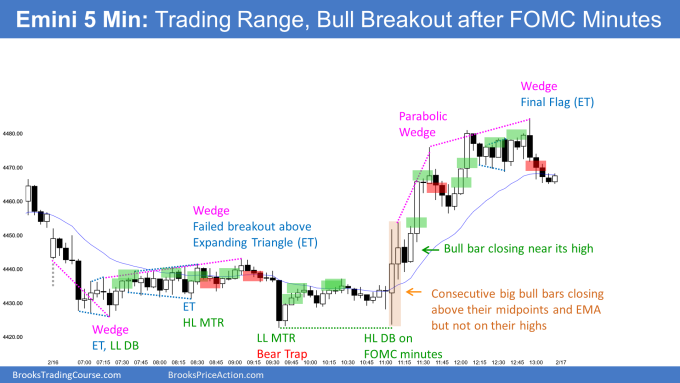
Here are several reasonable stop entry setups from yesterday. I show each buy entry with a green rectangle and each sell entry with a red rectangle. Buyers of both the Brooks Trading Course and Encyclopedia of Chart Patterns have access to a much more detailed explanation of the swing trades for each day (see Online Course/BTC Daily Setups).
My goal with these charts is to present an Always In perspective. If a trader was trying to be Always In or nearly Always In a position all day, and he was not currently in the market, these entries would be logical times for him to enter. These therefore are swing entries.
It is important to understand that most swing setups do not lead to swing trades. As soon as traders are disappointed, many exit. Those who exit prefer to get out with a small profit (scalp), but often have to exit with a small loss.
If the risk is too big for your account, you should wait for trades with less risk or trade an alternative market like the Micro Emini.
EURUSD Forex market trading strategies
EURUSD Forex daily chart

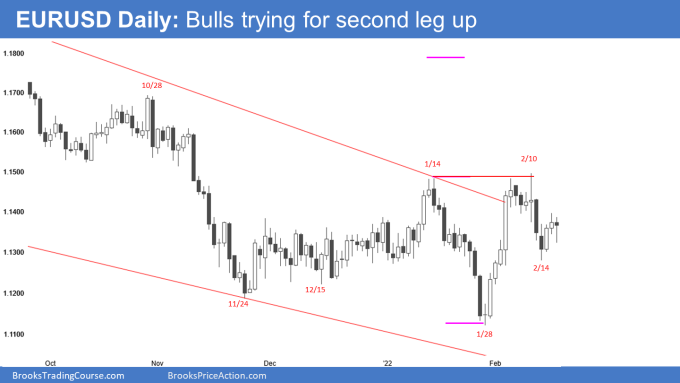
- Tuesday was a buy signal bar for the bulls and can be viewed as a high 1 or high 2, depending on how one views it.
- So far, the market has gone sideways for the past 9 days creating trading range price action. This will cause more traders to bet on reversals than successful breakouts.
- At the moment, the odds are that the 9 days sideways to down price action is more likely a pullback from the February 4 rally. This means the odds are that the market should attempt to get above the highs of February soon.
- The bulls are hopeful that Tuesday is a higher low major trend reversal and the start of that second leg up.
- The bears are hopeful this rally over the past two days is a pullback from the January/February double top, and the market will work its way down to the January lows.
- The odds are that the market is going to trend up on the daily chart for a couple of months, reaching the October high.
Summary of today’s S&P Emini futures price action and what to expect tomorrow

Al created the SP500 Emini charts.
End of day summary
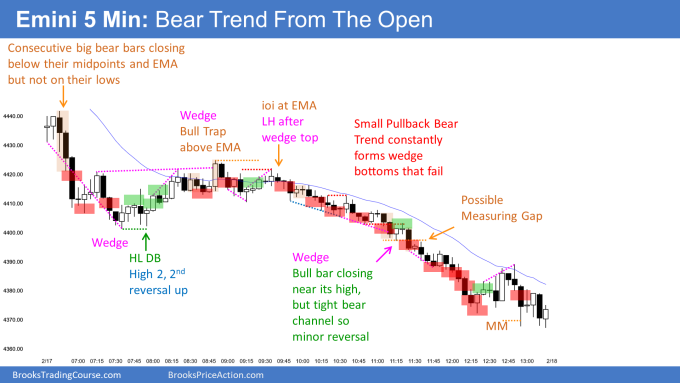
- Today was a trend from the open bear trend. The market became Always In Short during bars 3-5.
- The bulls tried to reverse the market after the first hour of the day, and the market ended up leading to a trading range for the next 2 hours.
- After the 2 hours of sideways, the market was in breakout mode, which means the probability of the market going up or down was close to 50% for each side. However, the odds slightly favored the bears.
- The market ended up forming a small pullback bull trend that broke below the trading range during bar 56 and ended up forming a measuring gap that led to a measured move down
- Small pullback trends are difficult to trade because they start out looking like a leg in a trading range but keep forming gaps. Then you see a leg in what looks like a trading range forming gaps. In general, It is better to wait for sideways or for gaps to start closing before looking to buy.
See the weekly update for a discussion of the price action on the weekly chart and for what to expect going into next week.
Trading Room
Traders can see the end of the day bar-by-bar price action report by signing up for free at BrooksPriceAction.com. I talk about the detailed S&P Emini futures price action real-time throughout the day in the BrooksPriceAction.com on trading room days. We offer a 2 day free trial.
Charts use Pacific Time
When I mention time, it is USA Pacific Time. The Emini day session charts begin at 6:30 am PT and end at 1:15 pm PT which is 15 minutes after the NYSE closes. You can read background information on the market reports on the Market Update page.
I Have a question. looking at Als videos when he has the E mini up the days are divided like regular market hrs. 0630 to 1300. the e min is 24hrs. Is he just removing that other time zone for teaching a benefit? Or is there a E min time frame that I am missing that can trade just those hrs? Im asking because if you are lets say trying to find the previous days high and low it seems that he is using daily market hrs but with the rest of the hrs the high or low of that day might have been much grater.
Thanks. Sam
Hi Sam, I see you also asked this question in the support forum, which is the right place for such questions. Al prefers to trade the regular trading hours session only, but he will make reference to Globex highs and lows for the overnight action when relevant, so no confusion. Al likes to align his trading with the stock market trading period as he will say sometimes.
@ Brad: Is the possible gap at bar 59 mostly an “afterthought” for a measured move? Or was the close of the 14th a strong clue in advance for targeting the low of the bear trend? Thanks!
I would look at it more as a successful bear breakout below the 2 hours trading range of that day. Bar 59 was confirmation that the bulls were failing. Overall it was a small pullback bear trend and it is usually better to assume the first reversal up will fail because they can go a long way down
Thanks Brad, that makes sense! Bar 19 in today’s chart (18Feb) is a similar possible gap for a MM, which is (also) coincidentally the February 14th lowest low
Why OO pattern on monthly chart make odds slightly higher of going below January low first than before taking highs? OO is an expanding triangle and a breakout pattern, so could have BO in either direction. Am I missing anything? Thanks!
You are right that an OO is a Breakout Mode pattern, which typically has a 50% chance of a bull breakout. But, it is the 2nd consecutive OO pattern in a buy climax, and why would that happen in a strong bull trend? It should not, and therefore it will probably lead to a pause in the trend. That is why I have been saying 2 – 3 months of sideways to down trading.
The bulls tried twice to go above the last OO. When a market tries to do something 2 or more times and fails, it then usually tries to do the opposite.
It is still a Breakout Mode pattern, and the odds are not 60 – 70%% that there will be a bear breakout. However, I believe they are better than 50%. Pick a number, 55%, 58%?
Thank you for your insights Dr. Brooks!
To better clarify the mathematical logic re monthly OO breakout probability. October was a bull OO vs September and January was a bear one vs December but closed in the middle which showed a sort of bull presence. So why the odds are for the bears, is it because we are in a climax area? I can understand the logic if it was twice bear OO.(to me it looks like October is an OO for both August and September).
Can a wedge be just two pushes down? -Specifically referencing bars 30-33.
Was a sell below the good bear bar, 32, reasonable?
When there are 3 pushes down and the 3rd does not fall below the 2nd, but the overall pattern is behaving like a wedge, I call that a truncated wedge. For example, if the 3rd leg falls one tick below the 2nd, it is a wedge. Is that significantly different from an identical pattern where the 3rd leg ended 2 ticks higher, one tick above the low of the second? No. They are both wedges, but one is a truncated wedge. The bulls were so eager to buy that there were many buy orders at and just above the low of the 2nd leg down. The result was a slightly higher low in what was very close to being a traditional wedge. When something is close to a pattern, it behaves like the pattern.