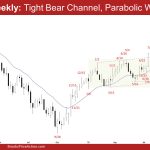
Market Overview: EURUSD Forex The weekly chart formed a EURUSD 9 consecutive bear bars with many candlesticks closing near their lows. That means strong bears. The odds continue to slightly favor sideways to down. However, the move down has lasted a long time and is slightly climactic. A minor pullback can begin within a few […]
If you are not seeing the latest Weekly Report below, your PC/device browser is likely showing you an earlier page copy. Simply refresh your browser. For PCs you can use the F5 key, or Ctrl-F5, several times if needed.
Bitcoin weak reversal up from bear ioi sell setup and 25k
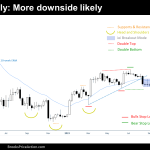
Market Overview: Bitcoin Bitcoin is reversing up from a bear ioi sell signal on the weekly chart. Both the Bulls and the Bears are active. The Bears sold a Bear Breakout of the Bull trend line. But the Bulls were trending during the year, and until proven wrong, Traders should suppose that the Bears will […]
Emini ii Pattern
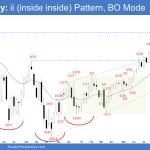
Market Overview: S&P 500 Emini Futures The weekly chart formed an Emini ii pattern (inside inside). The market is in breakout mode. The first breakout from an inside bar can fail 50% of the time. Traders will see if the bears can get a breakout below with follow-through selling or will the market trade slightly […]
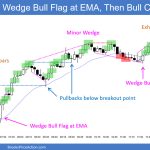
FTSE 100 Weak Signal, Strong Bull BO or LH DT?
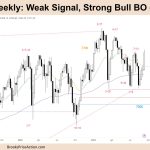
Market Overview: FTSE 100 Futures The FTSE futures market moved higher last week with a weak signal bar that turned into a strong bull BO. We said last week the pain trade might trap traders and it did. The bears wanted the LH and break below but too much buying pressure at the higher MAs below. […]
DAX 40 Big Bull Outside Up, Closing Above MA and in TTR
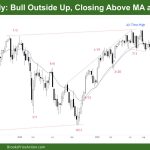
Market Overview: DAX 40 Futures DAX futures moved higher last week with a bull outside up bar closing above the MA and back in the middle of the TTR. Most bulls will want to see a consecutive bull close above the MA to get back to always in long. Some bulls are stuck high after […]
Nasdaq 100 Three Pushes up from 8/18
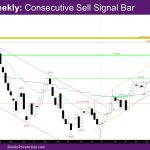
Market Overview: NASDAQ 100 Emini Futures The NASDAQ Emini futures week is a consecutive sell signal bar with its low above last week’s low. On the daily chart, this week looks like the 2nd and 3rd push of three pushes up from 8/18. The market tried breaking out above last week’s high and reversed. The […]
Nifty 50 Double Bottom
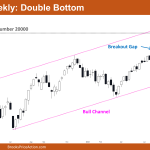
Market Overview: Nifty 50 Futures Nifty 50 Double Bottom on the weekly chart. On the weekly chart, the market is currently trading inside a large bull channel. This week, the market formed a strong bull close that resulted in a breakout of the important round number 20000. Bulls were able to obtain a breakout gap, […]
Emini Bears Want Low 2
Trading Update: Friday September 15, 2023 S&P Emini pre-open market analysis Emini daily chart Emini 5-minute chart and what to expect today Yesterday’s Emini setups Al created the SP500 Emini charts. Here are several reasonable stop entry setups from yesterday. I show each buy entry with a green rectangle and each sell entry with a […]
Emini Bulls Want Strong Entry Bar
Trading Update: Thursday September 14, 2023 S&P Emini pre-open market analysis Emini daily chart Emini 5-minute chart and what to expect today Emini intraday market update Yesterday’s Emini setups Al created the SP500 Emini charts. Here are several reasonable stop entry setups from yesterday. I show each buy entry with a green rectangle and each […]
Emini Buyers below Low 1
Trading Update: Wednesday September 13, 2023 S&P Emini pre-open market analysis Emini daily chart Emini 5-minute chart and what to expect today Yesterday’s Emini setups Al created the SP500 Emini charts. Here are several reasonable stop entry setups from yesterday. I show each buy entry with a green rectangle and each sell entry with a […]

