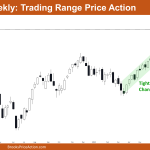
Market Overview: Nifty 50 Futures Nifty 50 Trading Range Price Action on the weekly chart. This week, the market created a small bear bar that closed close to its low and an inside bar pattern that could signal a gradual decline. The tight bull channel in which the weekly is still trading makes it more […]
If you are not seeing the latest Weekly Report below, your PC/device browser is likely showing you an earlier page copy. Simply refresh your browser. For PCs you can use the F5 key, or Ctrl-F5, several times if needed.
Emini Bears Want Follow-through on Weekly Chart
Trading Update: Friday August 11, 2023 S&P Emini pre-open market analysis Emini daily chart Emini 5-minute chart and what to expect today Yesterday’s Emini setups Al created the SP500 Emini charts. Here are several reasonable stop entry setups from yesterday. I show each buy entry with a green rectangle and each sell entry with a […]
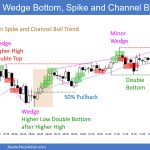
Emini Possible Wedge Bull Flag
Trading Update: Thursday August 10, 2023 S&P Emini pre-open market analysis Emini daily chart Emini 5-minute chart and what to expect today Emini intraday market update Yesterday’s Emini setups Al created the SP500 Emini charts. Here are several reasonable stop entry setups from yesterday. I show each buy entry with a green rectangle and each […]
Emini Bulls Hopeful for Test of 4,600
Trading Update: Wednesday August 9, 2023 S&P Emini pre-open market analysis Emini daily chart Emini 5-minute chart and what to expect today Emini intraday market update Yesterday’s Emini setups Al created the SP500 Emini charts. Here are several reasonable stop entry setups from yesterday. I show each buy entry with a green rectangle and each […]
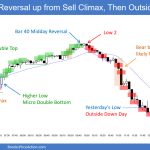
Emini 2nd Entry Buy
Trading Update: Tuesday August 8, 2023 S&P Emini pre-open market analysis Emini daily chart Emini 5-minute chart and what to expect today Yesterday’s Emini setups Al created the SP500 Emini charts. Here are several reasonable stop entry setups from yesterday. I show each buy entry with a green rectangle and each sell entry with a […]
Emini Bears Want Close below June 30th High
Trading Update: Monday August 7, 2023 S&P Emini pre-open market analysis Emini daily chart Emini 5-minute chart and what to expect today Friday’s Emini setups Al created the SP500 Emini charts. Here are several reasonable stop entry setups from Friday. I show each buy entry with a green rectangle and each sell entry with a […]
Emini Possible Minor Pullback
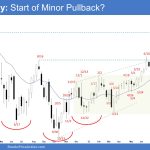
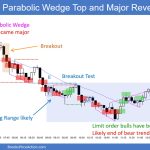
Market Overview: S&P 500 Emini Futures Is this the start of an Emini minor pullback? The bears will need to create consecutive strong bear bars closing near their lows to convince traders that a deeper pullback could be underway. The bulls want any pullback to be shallow and weak (with overlapping bars, doji(s) and bull […]
Crude Oil Bull Microchannel
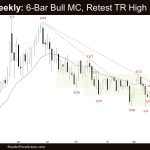
Market Overview: Crude Oil Futures The market formed a 6-bar Crude Oil Bull Microchannel on the weekly chart. It is a strong bull leg which increases the odds of buyers below the first pullback. The bulls want a breakout above the trading range high (April high). The bears want the market to stall around the […]
EURUSD Broad Bull Channel
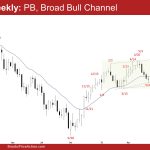
Market Overview: EURUSD Forex The last 7 candlesticks (monthly chart) have a lot of overlapping ranges but are sloping slightly up – the market is in a EURUSD broad bull channel following a bull spike from November. The bulls want a strong breakout above the April high followed by a few months of sideways to […]
Bitcoin 1st leg up loss of momentum
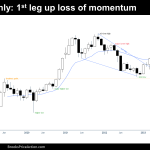
Market Overview: Bitcoin Futures Bitcoin futures 1st leg up loss of momentum. During July, the value of a Bitcoin decreased 4.22%. Traders wonder if this is the start of a retracement. A 1st leg up loss of momentum normally anticipates a retracement. Bitcoin futures The logarithmic Monthly chart of Bitcoin futures Analysis Trading The Weekly […]

