Trading Update: Wednesday August 16, 2023 Sorry, but no written report today — back tomorrow, Thursday Summary of today’s S&P Emini price action Al created the SP500 Emini chart.
If you are not seeing the latest Weekly Report below, your PC/device browser is likely showing you an earlier page copy. Simply refresh your browser. For PCs you can use the F5 key, or Ctrl-F5, several times if needed.
Emini Bulls Want Strong Follow-through
Trading Update: Tuesday August 15, 2023 S&P Emini pre-open market analysis Emini daily chart Emini 5-minute chart and what to expect today Yesterday’s Emini setups Al created the SP500 Emini charts. Here are several reasonable stop entry setups from yesterday. I show each buy entry with a green rectangle and each sell entry with a […]
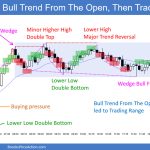
Emini Trading Range Likely Soon
Trading Update: Monday August 14, 2023 S&P Emini pre-open market analysis Emini daily chart Emini 5-minute chart and what to expect today Friday’s Emini setups Al created the SP500 Emini charts. Here are several reasonable stop entry setups from Friday. I show each buy entry with a green rectangle and each sell entry with a […]
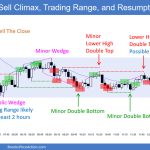
Emini Follow-through Selling
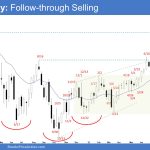
Market Overview: S&P 500 Emini Futures The bears got S&P 500 Emini follow-through selling on the weekly chart. The minor pullback phase has likely begun. A reasonable target for the bears is the 20-week exponential moving average. The bulls want the pullback to be weak and sideways, followed by a retest of the recent extreme […]
Crude Oil 7-Bar Bull Microchannel, Bull Leg
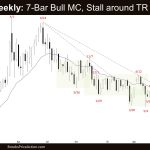
Market Overview: Crude Oil Futures The market formed a Crude Oil 7-bar bull microchannel on the weekly chart. That means strong bulls and increases the odds that the first pullback will be minor. The bears want the market to stall around the 38-week trading range high and for the bear leg to begin. Crude oil […]
EURUSD Wedge Top, PB
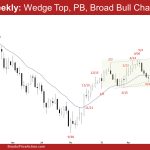
Market Overview: EURUSD Forex The bears want a reversal down from a EURUSD Wedge Top and a failed breakout above the April high. They need to continue creating consecutive bear bars, breaking far below the 20-week exponential moving average to increase the odds of a reversal down. The bulls want the 20-week exponential moving average […]
Bitcoin tightening its range below $30000
Market Overview: Bitcoin Futures Bitcoin is tightening its range on the Daily chart. This past week’s candlestick is a bull doji bar, with a close below its midpoint. The value of a Bitcoin increased 1.64% during the past week. Bitcoin futures The Weekly chart of Bitcoin futures Past (Supports & Resistances) “Every market probes up […]
DAX 40 Still a Tight Trading Range at MA in Bull Trend
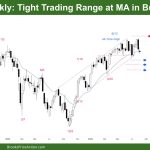
Market Overview: DAX 40 Futures DAX futures moved lower last week with follow-through selling in a tight trading range, but it was not able to close below the bar from the week before. So it’s not as bearish as it could be. Bulls have finally got a chance to buy the moving average, and in […]
Nasdaq 100 First Pair of Strong Bear Bars since December
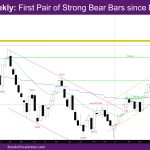
Market Overview: NASDAQ 100 Emini Futures The NASDAQ Emini futures week is a bear bar with small tails. This is the first pair of strong bear bars since December 2022. Bears needed a follow-through bar to the outside down (OD) bar last week, and they got it this week. The August monthly bar low has […]
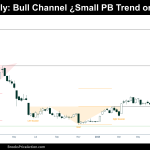
Nifty 50 Trading Range Price Action
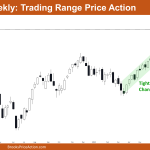
Market Overview: Nifty 50 Futures Nifty 50 Trading Range Price Action on the weekly chart. This week, the market created a small bear bar that closed close to its low and an inside bar pattern that could signal a gradual decline. The tight bull channel in which the weekly is still trading makes it more […]

