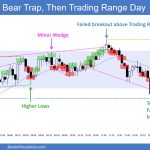
Trading Update: Tuesday July 25, 2023 S&P Emini pre-open market analysis Emini daily chart Emini 5-minute chart and what to expect today Yesterday’s Emini setups Al created the SP500 Emini charts. Here are several reasonable stop entry setups from yesterday. I show each buy entry with a green rectangle and each sell entry with a […]
If you are not seeing the latest Weekly Report below, your PC/device browser is likely showing you an earlier page copy. Simply refresh your browser. For PCs you can use the F5 key, or Ctrl-F5, several times if needed.
Nasdaq 100 Failed Breakout above June?
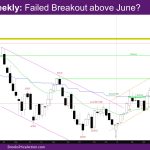
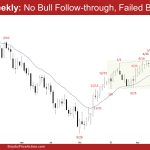
Market Overview: NASDAQ 100 Emini Futures The NASDAQ Emini futures week is a bear reversal sell signal bar with a tail above, representing a failed breakout above June. Last week, the market was attempting a breakout above the June high with the big outside up bar. The bulls needed a follow-through bar this week. They […]
Emini Sideways and Breakout Mode
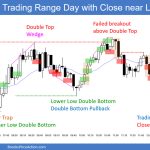
Trading Update: Monday July 24, 2023 S&P Emini pre-open market analysis Emini daily chart Emini 5-minute chart and what to expect today Friday’s Emini setups Al created the SP500 Emini charts. Here are several reasonable stop entry setups from Friday. I show each buy entry with a green rectangle and each sell entry with a […]
Emini Slightly Climactic, Always In Long
Market Overview: S&P 500 Emini Futures The market remains Always In Long with the Emini slightly climactic. The bears have not been able to create strong follow-through selling since the March low. They will need to create consecutive bear bars to increase the odds of a deeper pullback. The bulls want any pullback to be […]
Crude Oil Follow-through
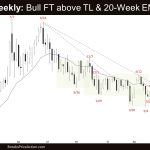
Market Overview: Crude Oil Futures The weekly chart formed a crude oil follow-through bull bar following last week’s close above the 20-week exponential moving average and the bear trend line. The bulls want a retest of the April high. The bears hope that the market will stall around the middle of the 35-week trading range and […]
EURUSD Failed Breakout?
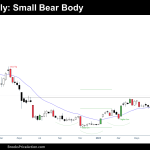
Market Overview: EURUSD Forex The market traded higher but reversed to close as a bear bar forming a possible EURUSD Failed Breakout. The bears will need to create follow-through selling to increase the odds of a deeper pullback. The bulls hope that the move down is simply a breakout test of the April high (breakout […]
Bitcoin agony Breakout Mode at the Bull Flag Top and 30000
Market Overview: Bitcoin Futures Bitcoin breakout mode at the bull flag top on the daily chart. During the week, the value of the crypto asset decreased by -1.48%. Traders are ready for a breakout attempt, or a big move up or down, next following weeks. Bitcoin futures The Weekly chart of Bitcoin futures Analysis Trading […]
Nifty 50 Big Round Number on Weekly Chart
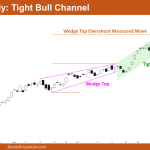
Market Overview: Nifty 50 Futures Nifty 50 Big Round Number on weekly chart. This week, the market had come close to the @20000 level but ran into strong resistance, creating a long tail at the top of this week’s bull bar. The market is trading inside of a tight bull channel on the weekly chart, […]
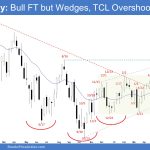
FTSE 100 Bull Follow-Through, Scale in Bulls Avoid a Loss
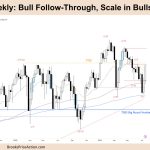
Market Overview: FTSE 100 Futures The FTSE futures market moved higher last week with a bull follow-through bar. It is a surprise and should have a second leg – though pullbacks have been deep, and it is the middle of a trading range. Traders should be looking to BLSHS. After such a tight bear channel, the […]
DAX 40 Bull Trap in TTR or Trend Resumption
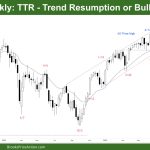
Market Overview: DAX 40 Futures DAX futures was a small bull follow-through bar but it did not close above the high of last week, so its a possible bull trap. Bulls want the stop-order to work and get back to the high close of the bull channel. Bears want tot rap them here and get […]

