Trading Update: Thursday February 2, 2023 Emini pre-open market analysis Emini daily chart Emini 5-minute chart and what to expect today Emini intraday market update Yesterday’s Emini setups Al created the SP500 Emini charts. Here are several reasonable stop entry setups from yesterday. I show each buy entry with a green rectangle and each sell […]
If you are not seeing the latest Weekly Report below, your PC/device browser is likely showing you an earlier page copy. Simply refresh your browser. For PCs you can use the F5 key, or Ctrl-F5, several times if needed.
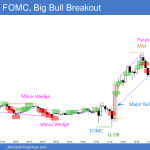
Bulls Want FOMC to Rally Market up to December 13 High
Trading Update: Wednesday February 1, 2023 Emini pre-open market analysis Emini daily chart Emini 5-minute chart and what to expect today Emini intraday market update Yesterday’s Emini setups Al created the SP500 Emini charts. Here are several reasonable stop entry setups from yesterday. I show each buy entry with a green rectangle and each sell […]
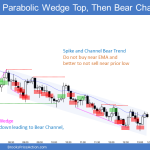
Emini Bears Follow-through Selling Wanted Today
Trading Update: Tuesday January 31, 2023 Emini pre-open market analysis Emini daily chart Emini 5-minute chart and what to expect today Emini intraday market update Yesterday’s Emini setups Al created the SP500 Emini charts. Here are several reasonable stop entry setups from yesterday. I show each buy entry with a green rectangle and each sell […]
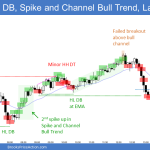
Emini Likely Close below Open and Disappoint Bulls
Trading Update: Monday January 30, 2023 Emini pre-open market analysis Emini daily chart Emini 5-minute chart and what to expect today Emini intraday market update Friday’s Emini setups Al created the SP500 Emini charts. Here are several reasonable stop entry setups from Friday. I show each buy entry with a green rectangle and each sell […]
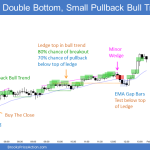
Emini Retesting December High
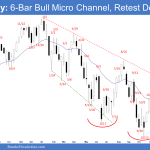
Market Overview: S&P 500 Emini Futures The S&P 500 Emini futures weekly candlestick was a bull bar retesting December high. It was also a breakout above the bear trend line. The bulls will need to create follow-through buying over the next several weeks. Bears see the selloff from January 2022 as a broad bear channel […]
Crude Oil Bear Inside Bar
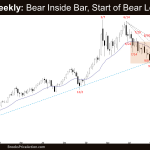
Market Overview: Crude Oil Futures The Crude oil futures weekly candlestick was a Crude Oil bear inside bar sitting under the 10-week trading range high, 20-week exponential moving average and the bear trend line. Bulls need to break far above these resistances to increase the odds of higher prices. The bears want a retest and breakout below […]
EURUSD Wedge and Micro Wedge
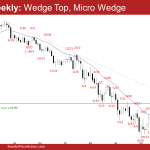
Market Overview: EURUSD Forex The EURUSD Forex formed a wedge and micro wedge on the weekly chart. However, the bears are still weak and need to do more to convince traders of a pullback or a reversal. The bulls want any pullback to be sideways and not deep. If the pullback is weak and sideways, […]
Bitcoin Testing 200-week Moving Average
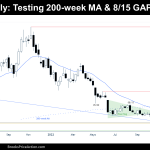
Market Overview: Bitcoin Futures Bitcoin futures testing 200-week moving average. During the week, the price increased +4.15% of its value. Tuesday is the last day of the month; So far, the Bitcoin price is up in January by +39.85%. Bitcoin futures The Weekly chart of Bitcoin futures Analysis Trading The Daily chart of Bitcoin futures Analysis […]
DAX 40 Possible Bull Leg in Trading Range, Tight Bull Channel
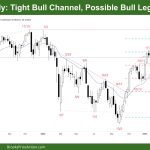
Market Overview: DAX 40 Futures DAX futures were in a tight bull channel last week. Traders are deciding if it is a possible bull leg in a trading range. The bulls are at one measured move target and want the swing target above. The bears want to sell to keep the price in the range […]
Nasdaq 100 Bull Breakout above Weekly EMA
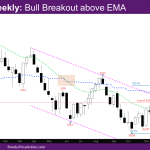
Market Overview: NASDAQ 100 Emini Futures The NASDAQ Emini futures market in breakout above weekly EMA (exponential moving average) and is back at the December high. The January monthly bar so far is a good bull reversal bar. A couple of problems for bulls: It is an inside bar (i.e. high and low within the […]

