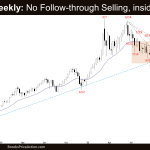
Market Overview: Crude Oil Futures There was no follow-through selling in the Crude oil futures market. The weekly candlestick was an inside bar closing near its high. Odds slightly favor a breakout above the inside bar. Traders will see if the bulls can create follow-through buying and a breakout above the 8-week trading range. Crude […]
If you are not seeing the latest Weekly Report below, your PC/device browser is likely showing you an earlier page copy. Simply refresh your browser. For PCs you can use the F5 key, or Ctrl-F5, several times if needed.
EURUSD Wedge Top but Tight Bull Channel
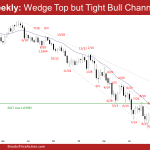
Market Overview: EURUSD Forex EURUSD wedge top formed but the rally is in a tight bull channel. The bear bars are weak and had no follow-through selling. Bears need to do more to convince traders that a pullback/reversal is imminent. Odds slightly favor EURUSD to trade at least a little higher. EURUSD Forex market The […]
Bitcoin testing 20-week EMA
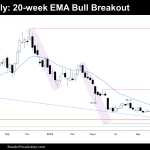
Market Overview: Bitcoin Futures Bitcoin futures are testing the 20-week exponential moving average (testing 20-week EMA). During the week, the Bitcoin price increased +15.71% of its value. After 8 weeks of extremely low volatility, traders wonder if this is the start of a large move. Bitcoin futures The Weekly chart of Bitcoin futures Analysis Trading […]
FTSE 100 Breakout above COVID Trading Range
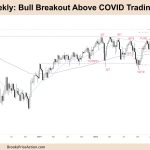
Market Overview: FTSE 100 Futures The FTSE futures market had a big bull breakout above COVID trading range. We are within striking distance of the All-Time-High. The bulls want to break strongly above the all-time high, and with consecutive weekly bull bars, it looks promising. But having spent so long in a trading range, the math […]
DAX 40 Breakout of Bull Flag
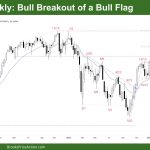
Market Overview: DAX 40 Futures DAX 40 breakout of bull flag with market moving higher last week. Consecutive bull bars closing near their highs. The bulls have needed to break above the wedge bottom and get closer to their swing target above 15000, which they did last week. The bears have been selling from January […]
Nasdaq 100 Back at Weekly EMA
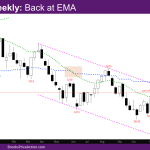
Market Overview: NASDAQ 100 Emini Futures The NASDAQ Emini futures market continues to be in a trading range and is back at weekly EMA exponential moving average (EMA). The market was at the bottom of the trading range from November for the past couple of weeks and appears to be making a bull leg of […]
Nifty 50 Triangle Fakeout
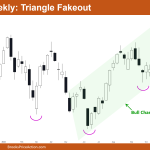
Market Overview: Nifty 50 Futures Nifty 50 triangle fakeout on the weekly chart. Last week’s market formed inside bar on the weekly chart which is a triangle pattern on smaller time frame charts. The market is trading near the bottom of the bull channel. Nifty 50 on the daily chart formed a cup & handle […]
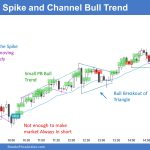
Emini Bears Want Reversal Down to Disappoint Bulls
Trading Update: Friday January 13, 2023 Emini pre-open market analysis Emini daily chart Emini 5-minute chart and what to expect today Emini intraday market update Yesterday’s Emini setups Al created the SP500 Emini charts. Here are several reasonable stop entry setups from yesterday. I show each buy entry with a green rectangle and each sell […]
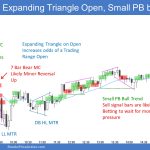
Emini Bulls Want Strong Follow Through
Trading Update: Thursday January 12, 2023 Emini pre-open market analysis Emini daily chart Emini 5-minute chart and what to expect today Emini intraday market update Yesterday’s Emini setups Brad created the SP500 Emini chart. Here are several reasonable stop entry setups from yesterday. I show each buy entry with a green rectangle and each sell […]
Emini Bulls Measuring Gap and Measured Move up Wanted
Trading Update: Wednesday January 11, 2023 Emini pre-open market analysis Emini daily chart Emini 5-minute chart and what to expect today Emini intraday market update Yesterday’s Emini setups Brad created the SP500 Emini charts. Here are several reasonable stop entry setups from yesterday. I show each buy entry with a green rectangle and each sell […]

