Trading Update: Tuesday January 10, 2023 Emini pre-open market analysis Emini daily chart Emini 5-minute chart and what to expect today Emini intraday market update Yesterday’s Emini setups (Delayed: Chart will be posted Mid-Afternoon on Jan 11th) Brad created the SP500 Emini charts. Here are several reasonable stop entry setups from yesterday. I show each […]
If you are not seeing the latest Weekly Report below, your PC/device browser is likely showing you an earlier page copy. Simply refresh your browser. For PCs you can use the F5 key, or Ctrl-F5, several times if needed.
Emini Bulls Follow-through Wanted after Friday’s Strong Close
Trading Update: Monday January 9, 2023 Emini pre-open market analysis Emini daily chart Emini 5-minute chart and what to expect today Emini intraday market update Friday’s Emini setups Brad created the SP500 Emini charts. Here are several reasonable stop entry setups from Friday. I show each buy entry with a green rectangle and each sell […]
Emini Pullback or Second Leg Up?
Market Overview: S&P 500 Emini Futures The S&P 500 Emini futures traded slightly higher and traders are wondering if this is a pullback or second leg up to retest the December high. The bulls will need to create follow-through buying next week to increase the odds of retesting the December high. The bears want the Emini to […]
Crude Oil Third Leg Down?
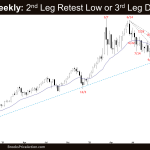
Market Overview: Crude Oil Futures The Crude oil futures traded lower and traders are wondering if it is forming a third leg down with the first two legs being Sept 26 and Dec 9. The bulls want a reversal higher from a double bottom with the December low. Crude Oil could be forming a trending trading range […]
EURUSD Weak Bear Bar, Need Follow-through
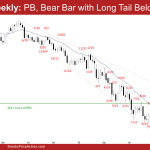
Market Overview: EURUSD Forex The EURUSD Forex was a EURUSD weak bear bar on the weekly chart. The bears want this to be the start of a two-legged sideways-to-down pullback. They will need to create follow-through selling next week. The bulls want any pullback to be sideways and not deep. EURUSD Forex market The Weekly EURUSD chart […]
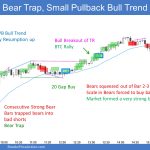
Bitcoin First Week of 2023
Market Overview: Bitcoin Futures Bitcoin futures gapped up on the open of the Bitcoin first week of 2023 and ended with a +2.18% gain. During the last report, we explained in detail how the annual and monthly charts might influence the long-term landscape for Bitcoin. Bitcoin futures The Weekly chart of Bitcoin futures Analysis Trading […]
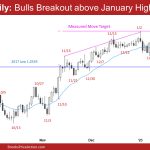
FTSE 100 Big Bull Breakout Testing Pre-Pandemic High
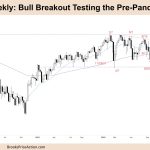
Market Overview: FTSE 100 Futures The FTSE futures market was a big bull breakout testing the pre-pandemic high. The bulls want this to be a bull flag of the post-pandemic bull run. But with several breakout attempts, traders wonder if this has increased or decreased probability. The bulls have measured move targets above. With such strong […]
DAX 40 Big Bull Breakout: Measuring Gap or Exhaustion Gap?
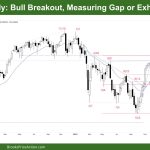
Market Overview: DAX 40 Futures DAX futures moved higher last week with a DAX 40 big bull breakout bar. It has been non-stop higher since October, and traders want to see if there are buyers above this trading range high. The bears knew they would not get a bear trend but hoped for a trading […]
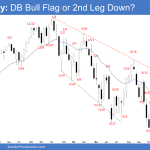
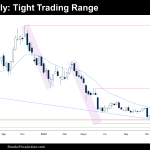
Nasdaq 100 Pair of Weekly Bear Doji Bars
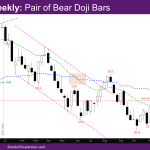
Market Overview: NASDAQ 100 Emini Futures The NASDAQ Emini futures market has been going sideways for the past two weeks around the bottom of the trading range from early November. Given the pair of weekly bear doji bars over past two weeks, the market will likely make at least a small second leg down for […]
Nifty 50 Inside Bar Pattern
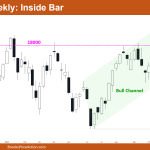
Market Overview: Nifty 50 Futures Nifty 50 inside bar pattern on the weekly chart and still trading near the bottom of the bull channel. Bulls and bears can expect some sideways price action for the next few bars. Nifty 50 is trading inside a bear channel on the weekly chart and can fall to a […]

