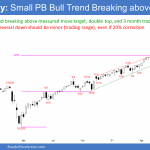
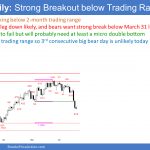
Market Overview: Weekend Market Analysis The SP500 Emini futures reversed up strongly this week. It is breaking above a 3-month trading range and a measured move target. Emini rally accelerating into the 4th of July possible. The EURUSD Forex market formed a bull inside bar after a big bear breakout last week. This creates confusion […]
If you are not seeing the latest Weekly Report below, your PC/device browser is likely showing you an earlier page copy. Simply refresh your browser. For PCs you can use the F5 key, or Ctrl-F5, several times if needed.
SP500 Emini trade setups

For Thursday June 24, 2021 Full Emini and Forex daily reports will only be issued when Al is in the Trading Room. See sidebar calendar for “No Webinar” days when this “SP500 Emini trade setups” post will replace the daily report. Here are several reasonable stop entry setups from yesterday. I show each buy entry […]
Emini late June rally should break to new high
Trading Update: Thursday June 24, 2021 Emini pre-open market analysis Emini daily chart After 2 big bull days, yesterday was likely to pause, and it did. It was a small bear doji bar. The Emini might pull back for a day or two, but traders should expect a break to new high. Yesterday is a […]
SP500 Emini trade setups
For Tuesday June 22, 2021 Full Emini and Forex daily reports will only be issued when Al is in the Trading Room. See sidebar calendar for “No Webinar” days when this “SP500 Emini trade setups” post will replace the daily report. Here are several reasonable stop entry setups from yesterday. I show each buy entry […]
Emini rallying from bear trap (late June)
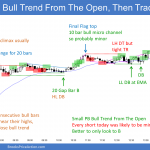
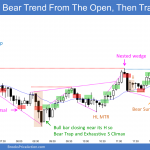
Trading Update: Tuesday June 22, 2021 Emini pre-open market analysis Emini daily chart Yesterday opened near Friday’s open with the Emini rallying from bear trap. A bull day after a big bear day where there is very little overlap between the 2 days is bullish. Many of Friday’s sellers did not exit today. If they […]
SP500 Emini trade setups
For Friday June 18, 2021 Full Emini and Forex daily reports will only be issued when Al is in the Trading Room. See sidebar calendar for “No Webinar” days when this “SP500 Emini trade setups” post will replace the daily report. Here are several reasonable stop entry setups from Friday. I show each buy entry […]
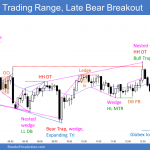
Emini reversing down from June’s wedge rally to double top
Market Overview: Weekend Market Analysis The SP500 Emini futures market is reversing down on the daily chart from a wedge rally to double top (higher high) with the May high. If the bears get follow-through selling next week, the rally will test the May low. The EURUSD Forex market on the weekly chart is reversing […]
Emini High 1 buy signal bar but weak after June FOMC
Trading Update: Friday June 18, 2021 Emini pre-open market analysis Emini daily chart Fell below Wednesday’s low, but reversed up and closed just above open. Yesterday is an Emini High 1 buy signal bar, but after 2 big bear days, and without a big bull body, it is a weak buy setup. However, it was […]
SP500 Emini trade setups
For Wednesday June 16, 2021 Full Emini and Forex daily reports will only be issued when Al is in the Trading Room. See sidebar calendar for “No Webinar” days when this “SP500 Emini trade setups” post will replace the daily report. Here are several reasonable stop entry setups from yesterday. I show each buy entry […]
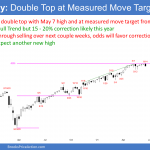
Emini might make big move today after June FOMC report
Trading Update: Wednesday June 16, 2021 Emini pre-open market analysis Emini daily chart Even though buy climaxes on weekly and monthly charts, no credible top, so odds favor higher prices. June FOMC report at 11am PT today. Tight bull channel on daily chart for 4 weeks, so traders continue to expect higher prices. They will […]

