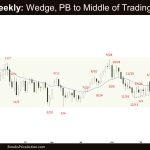
Market Overview: Crude Oil Futures The market formed a weekly Crude Oil pullback to the middle of the trading range on the weekly chart. The bulls want a retest of the April 12 high after the current pullback and the bull trend line to act as support. The bears want the 20-week EMA and the bear trend line to […]
Emini Sideways to Up
Market Overview: S&P 500 Emini Futures The market formed an Emini sideways to up breaking into new high territory. The bulls want to get another strong leg up completing the wedge pattern with the first two legs being July 27 and March 21. The third leg up is currently underway. If the market trades higher, the bears want a micro wedge to form […]
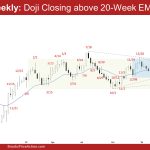
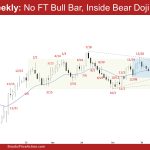
Weekly Emini Higher High MTR
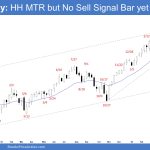
Market Overview: S&P 500 Emini Futures The market formed a weekly Emini higher high MTR (major trend reversal) pattern. The bulls need to create a follow-through bull bar to confirm the breakout above the all-time high, even if it is only a bull doji. The bears need to create a few strong bear bars to increase the […]
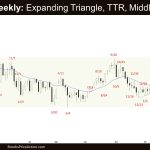
Weak Crude Oil Breakout
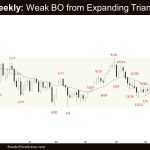
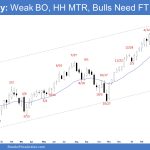
Market Overview: Crude Oil Futures The weekly chart formed a weak Crude Oil breakout from the small expanding triangle. The bulls want the 20-week EMA or the bull trend line to act as support. They want a failed breakout below the bull trend line. The bears need to create follow-through selling trading far below the […]
Weekly EURUSD Double Top Bear Flag

Market Overview: EURUSD Forex The market formed a weekly EURUSD double top bear flag (Apr 9 and May 16). The bears want a reversal from a double top bear flag and a small double top (May 16 and Jun 4). If there is a deeper pullback, the bulls want a reversal from a higher low major trend […]
EURUSD Triangle
Market Overview: EURUSD Forex The monthly chart formed a EURUSD triangle. The bulls need to create a follow-through bull bar in June to increase the odds of higher prices. If the market trades higher, the bears want a reversal from a double top bear flag with the March 8 high. EURUSD The Monthly EURUSD Forex […]
Weekly Crude Oil Tight Trading Range
Market Overview: Crude Oil Futures The market formed a weekly Crude Oil tight trading range in the form of 4 overlapping candlesticks. The bears see the tight trading range simply as a sideways pullback and want another strong leg down. The bulls want the 20-week EMA or the bull trend line to act as support. […]
Emini Buyers below the First Pullback
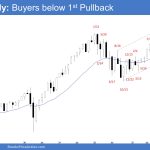
Market Overview: S&P 500 Emini Futures There were Emini buyers below the first pullback on the monthly chart. The bulls hope to get another strong leg up completing the wedge pattern with the first two legs being July 27 and March 21. The bears want a reversal from a higher high major trend reversal and a large wedge pattern (Dec 2, July 27, and March 21). S&P500 […]
No Weekly EURUSD Follow-through
Market Overview: EURUSD Forex There was no weekly EURUSD follow-through bull bar following last week’s close above the 20-week EMA. The bulls need to create follow-through buying trading above the 20-week EMA to increase the odds of retesting the December high. The bears see the recent moves simply as a deep pullback and want at least a small […]
Crude Oil OO Pattern
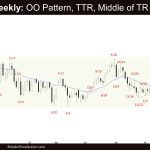
Market Overview: Crude Oil Futures The weekly chart formed a Crude Oil OO pattern (outside-outside) which means the market is in breakout mode. Crude Oil is currently trading around the middle of the large trading range, which is an area of balance. The overlapping price action in the last 3 weeks also indicates that the market is in a tight trading range. Crude oil futures The […]

