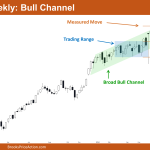
Market Overview: Nifty 50 Futures Nifty 50 Bull Channel on the weekly chart. The market on the weekly chart closed with a bearish candlestick. The bear bar has a small body with small tails on either side. The market is trading near the top of the bull channel, and this week it nearly reached the […]
Nifty 50 Trading Range Breakout
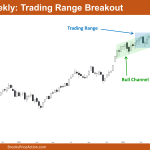
Market Overview: Nifty 50 Futures Nifty 50 Trading Range Breakout on the weekly chart. This week, the market closed with a small bullish body, indicating a trading range price action on the lower time frame after the high volatility caused by the election results. The market also broke out of the trading range, suggesting a […]
Nifty 50 Wedge Overshoot
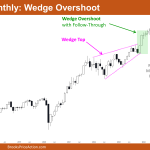
Market Overview: Nifty 50 Futures Nifty 50 Wedge Overshoot on the monthly chart. The market on the monthly chart (May month bar) gave a doji close. Bulls were able to follow through well after the wedge overshoot and are still continuing that bull leg. The weekly chart shows a very big outside bar that covered […]
Nifty 50 Bull Breakout
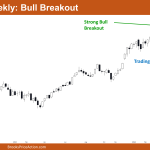
Market Overview: Nifty 50 Futures Nifty 50 Bull Breakout on the weekly chart. The market on the weekly chart formed a strong consecutive bull bar this week, resulting in a robust bull breakout of the trading range. This indicates a measured move up based on the height of the trading range. Bears need at least […]
Nifty 50 Bull Channel
Market Overview: Nifty 50 Futures Nifty 50 Bull Channel on the weekly chart. This week, the market formed a strong bull bar that closed near its high, following a strong bear bar. This indicates an increasing trading range price action. On the weekly chart, the market is trading inside a weak bull channel, characterized by […]
Nifty 50 Bull Micro Channel
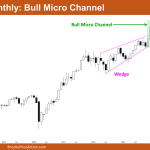
Market Overview: Nifty 50 Futures Nifty 50 Bull Micro Channel on the monthly chart. This month, the market closed with a weak bullish pattern, showing a small body and a tail at the bottom. Currently, on the monthly chart, the market is experiencing a breakout phase because of the bullish breakout of the wedge top. […]
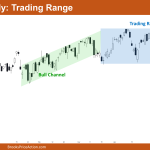
Nifty 50 Trading Range Price Action
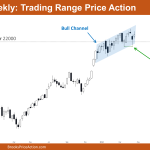
Market Overview: Nifty 50 Futures Nifty 50 Trading Range Price Action on weekly chart. On the weekly chart, the market has shown a small, weak bull bar with a long tail at the top, indicating it remains in a phase of trading range rather than trending. Last week’s micro double bottom formation remains intact, potentially […]
Nifty 50 Micro Double Bottom
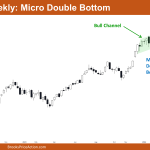
Market Overview: Nifty 50 Futures Nifty 50 Micro Double Bottom on the weekly chart. This week, the market closed with a weak bearish tone. The candle shows a small bearish body with a long tail at the bottom. This weak close reduces the likelihood of a significant trend reversal. Instead, the bears might see a […]
Nifty 50 Breakout Failed
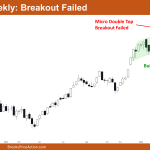
Market Overview: Nifty 50 Futures Nifty 50 Breakout Failed on the weekly chart. This week, the market showed a small bear doji bar with a short tail at the top, still trading within the bull channel. Last week, there was a micro double top formation in the market. Although the bulls managed to break above […]
Nifty 50 Micro Double Top
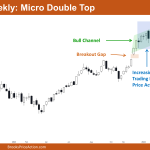
Market Overview: Nifty 50 Futures Nifty 50 Micro Double Top on the weekly chart. This week, the market formed a Micro Double Top, followed by a weak small bull doji bar. Currently, it’s trading within a bull channel, albeit a weak one. The price action within this channel resembles trading range behavior, indicating that traders […]

