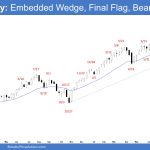
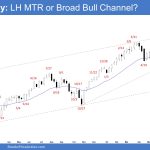
Market Overview: S&P 500 Emini Futures The market formed a monthly Emini reversal bar in October. The bears want a reversal from a wedge (Mar 21, Jul 16 and Oct 17) and an embedded wedge (Mar 21, Jul 16 and Oct 17). To increase the odds of a deeper pullback, they must create a strong […]
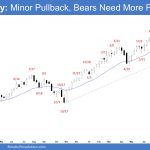
Weekly Emini Pullback
Market Overview: S&P 500 Emini Futures The market formed a weekly Emini pullback, closing as a bear bar with a prominent tail below. The bears need to create a follow-through bear bar next week to increase the odds of a deeper pullback. The bulls see another possible embedded wedge forming (the first two legs are […]
Weekly Emini Sideways to Up
Market Overview: S&P 500 Emini Futures The market is forming a weekly Emini sideways to up, closing in new high territory. The bears want a reversal from a higher high major trend reversal. The problem with the bear’s case is that they haven’t been able to create strong bear bars with follow-through selling. Until they […]
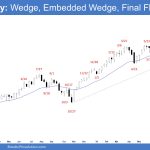
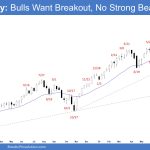
Weekly Emini Breakout
Market Overview: S&P 500 Emini Futures The market formed a weekly Emini breakout into new all-time high. The bulls want another leg up completing the wedge pattern with the first two legs being March 21 and July 16 highs and the embedded wedge in the current leg up with the first two legs being August […]
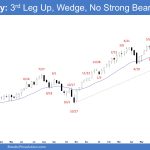
Monthly Emini Third Leg Up
Market Overview: S&P 500 Emini Futures The market is forming a monthly Emini third leg up, with the first two legs being the March 21 and July 16 highs. The bulls want another leg up completing the wedge pattern and the embedded micro wedge pattern with the first two legs being the August 30 and […]
Emini Losing Momentum
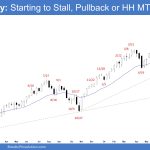
Market Overview: S&P 500 Emini Futures The weekly chart indicates an Emini losing momentum with the progressive smaller bull bars in the last 3 weeks. If the market trades lower, the bulls want the 20-week EMA or the bull trend line to act as support, forming a double bottom bull flag with the September 6 […]
Emini Retest All-time High
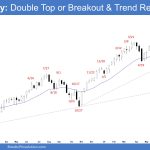
Market Overview: S&P 500 Emini Futures The market formed an Emini retest all-time high this week. The bulls must create a strong breakout with follow-through buying to increase the odds of the trend resuming. The bears want a reversal from a double top (Jul 16 and Sep 19) and a higher high major trend reversal. […]
Weekly Emini Retest High
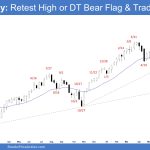
Market Overview: S&P 500 Emini Futures The market formed a weekly Emini retest high following last week’s pullback to the 20-week EMA. The bears want a reversal from a lower high major trend reversal or a double top with the all-time high and a double top bear flag with the August 30 high. The bulls […]
Weekly Emini Big Pullback
Market Overview: S&P 500 Emini Futures The market formed a weekly Emini big pullback with a big bear bar testing the 20-week EMA. The bears need to create a follow-through bear bar to increase the odds of retesting the August low. The pullback is stronger than the bulls hoped it would be. They hope to […]
Monthly Emini Double Bottom Bull Flag
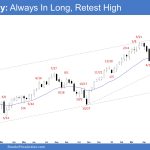
Market Overview: S&P 500 Emini Futures The market formed a monthly Emini double bottom bull flag and retest of the all-time high. The bulls want a breakout with follow-through buying, resuming the broad bull channel. The bears see the current move as a retest of the all-time high and want a reversal from a lower […]

