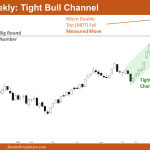
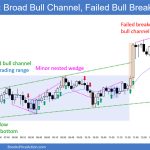
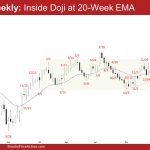
Market Overview: Nifty 50 Futures Nifty 50 Tight Bull Channel on the weekly chart. This week, the market closed with a bullish tone, although the body of the candle was small. However, there’s a noticeable decline in upward momentum on the weekly chart, reflected in the diminishing size of bullish bodies in recent weeks. Despite […]
Emini Testing 5,200
Trading Update: Friday March 8, 2024 S&P Emini pre-open market analysis Emini daily chart Emini Intra Day Update Yesterday’s Emini setups Al created the SP500 Emini charts. Here are reasonable stop entry setups from yesterday. I show each buy entry bar with a green arrow and each sell entry bar with a red arrow. Buyers […]
Emini Trading Range Forming on Daily
Trading Update: Thursday March 7, 2024 S&P Emini pre-open market analysis Emini daily chart Emini 5-minute chart and what to expect today Yesterday’s Emini setups Al created the SP500 Emini charts. Here are reasonable stop entry setups from yesterday. I show each buy entry bar with a green arrow and each sell entry bar with […]
Emini Buyers near Moving Average
Trading Update: Wednesday March 6, 2024 S&P Emini pre-open market analysis Emini daily chart Emini 5-minute chart and what to expect today Yesterday’s Emini setups Al created the SP500 Emini charts. Here are reasonable stop entry setups from yesterday. I show each buy entry bar with a green arrow and each sell entry bar with […]
Emini Profit Taking on Daily Chart
Trading Update: Tuesday March 5, 2024 S&P Emini pre-open market analysis Emini daily chart Emini 5-minute chart and what to expect today Yesterday’s Emini setups Al created the SP500 Emini charts. Here are reasonable stop entry setups from yesterday. I show each buy entry bar with a green arrow and each sell entry bar with […]
Emini Bulls Hopeful for Follow-through Buying
Trading Update: Monday March 4, 2024 S&P Emini pre-open market analysis Emini daily chart Emini 5-minute chart and what to expect today Friday’s Emini setups Al created the SP500 Emini charts. Here are reasonable stop entry setups from Friday. I show each buy entry bar with a green arrow and each sell entry bar with […]
Emini Breakout
Market Overview: S&P 500 Emini Futures The monthly chart formed an Emini breakout above the prior all-time high. The bulls will need to create a follow-through bull bar in March to confirm the breakout even if it is just a bull doji. The bears will need a strong sell signal bar or a micro double […]
Crude Oil Wedge
Market Overview: Crude Oil Futures The monthly chart is forming a Crude Oil wedge bear flag. The bulls will need to create a follow-through bull bar closing above the 20-month EMA to increase the odds of the bull leg beginning. The bears want a retest of the December low from a wedge bear flag (Dec […]
EURUSD Doji
Market Overview: EURUSD Forex The monthly chart formed a EURUSD doji in the middle of the trading range and at the 20-month EMA. The bulls want the 20-month EMA to act as support. The bears will need to create follow-through selling below the 20-month EMA to increase the odds of a retest of the October […]
Bitcoin en los $60000 tras una impresionante subida
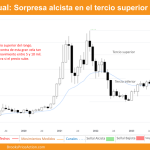
Visión del mercado En nuestro último informe de Bitcoin, observamos con cautela el gran doji de enero como un posible doble techo, lo que generó preocupación por una reversión del precio. Sin embargo, febrero desafió las expectativas con una poderosa vela de ruptura alcista, impulsando el precio de $40,000 a unos asombrosos $60,000, ¡un notable […]

