Trading Update: Thursday February 8, 2024 S&P Emini pre-open market analysis Emini daily chart Emini 5-minute chart and what to expect today Yesterday’s Emini setups Al created the SP500 Emini charts. Here are reasonable stop entry setups from yesterday. I show each buy entry bar with a green arrow and each sell entry bar with […]
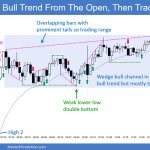
Emini Likely to Reach 5,000 Today
Trading Update: Wednesday February 7, 2024 S&P Emini pre-open market analysis Emini daily chart Emini 5-minute chart and what to expect today Yesterday’s Emini setups Al created the SP500 Emini charts. Here are reasonable stop entry setups from yesterday. I show each buy entry bar with a green arrow and each sell entry bar with […]
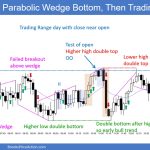
Emini Inside Bar below Support
Trading Update: Tuesday February 6, 2024 S&P Emini pre-open market analysis Emini daily chart Emini 5-minute chart and what to expect today Yesterday’s Emini setups Al created the SP500 Emini charts. Here are reasonable stop entry setups from yesterday. I show each buy entry bar with a green arrow and each sell entry bar with […]
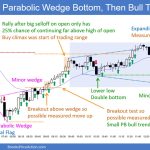
Emini Testing 5,000 Round Number
Trading Update: Monday February 5, 2024 S&P Emini pre-open market analysis Emini daily chart Emini 5-minute chart and what to expect today Friday’s Emini setups Al created the SP500 Emini charts. Here are reasonable stop entry setups from Friday. I show each buy entry bar with a green arrow and each sell entry bar with […]
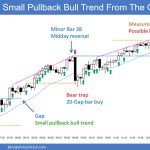
Emini Test All-Time High
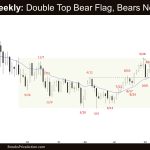
Market Overview: S&P 500 Emini Futures The monthly chart is forming an Emini test all-time high. The bulls hope that the market will reach the all-time high and break out above. The bears want a reversal from a lower high major trend reversal or a double top and a large wedge pattern (Dec 2, July […]
Crude Oil Trading Range
Market Overview: Crude Oil Futures The monthly chart is forming a Crude Oil trading range. The bulls want a reversal from a higher low major trend reversal and a double bottom bull flag (May 4 and Dec 13). The bears see January simply as a pullback and want a second leg sideways to down. They […]
EURUSD Trading Range
Market Overview: EURUSD Forex The monthly chart formed a EURUSD trading range closing as an inside bear bar. The bears need to create a follow-through bear bar closing below the 20-month EMA to increase the odds of reaching the October low. The bulls want the 20-month EMA to act as support. EURUSD Forex market The […]
Bitcoin Doble Techo con Máximo 2022 en gráfico Mensual
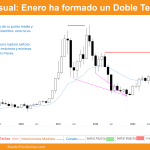
Visión del mercado Durante la semana pasada, se han suscitado acontecimientos significativos en el mercado de Bitcoin. Uno de los aspectos más destacados fue el cierre de la vela mensual, un evento crucial para los participantes del mercado. Las instituciones suelen considerar el mes de enero como un barómetro para evaluar las tendencias y el […]
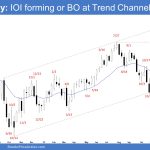
FTSE 100 High 2 Breakout Pullback, 2nd Leg Up
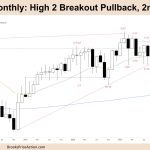
Market Overview: FTSE 100 Futures FTSE 100 futures moved sideways last month with a bear outside bar, unable to close below the MA in a breakout pullback. It looks like a swing-long setup, but traders have been in a TTR for a long time, so they might wait for more confirmation or urgency. Bears have […]
DAX 40 Bull Channel, ATH, Sideways Above Strong Pullback
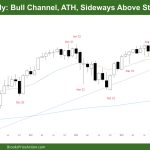
Market Overview: DAX 40 Futures DAX futures went sideways last month with a small bull inside bar high at the top of a bull channel. The bears got 3 good bear bars and tried to create a double top. But they weren’t able to get a follow-through barb under the MA. Strong bull bars above […]

