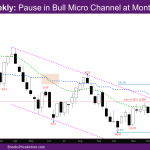
Market Overview: NASDAQ 100 Emini Futures The NASDAQ Emini futures continued pause with another doji week sideways at the monthly exponential moving average (EMA). The month so far is a bull bar with a big tail above. As expected, the upside was limited given big sideways bars in the previous few months. It is likely […]
Emini Bears Want Downside Breakout and Test of February 10 Low
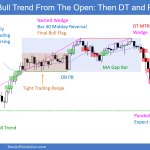
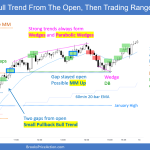
Trading Update: Friday February 17, 2023 Emini pre-open market analysis Emini daily chart Emini 5-minute chart and what to expect today Emini intraday market update Yesterday’s Emini setups Tim created the SP500 Emini chart from Al’s provided summary & setups Here are several reasonable stop entry setups from yesterday. I show each buy entry with […]
Emini in Breakout Mode, Forming Triangle above Moving Average
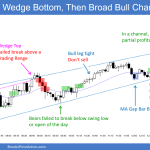
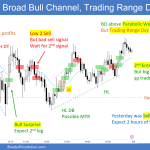
Trading Update: Thursday February 16, 2023 Emini pre-open market analysis Emini daily chart Emini 5-minute chart and what to expect today Emini intraday market update Yesterday’s Emini setups Tim created the SP500 Emini chart from Al’s provided summary & setups Here are several reasonable stop entry setups from yesterday. I show each buy entry with […]
Emini Sideways Most Likely
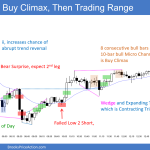
Trading Update: Wednesday February 15, 2023 Emini pre-open market analysis Emini daily chart Emini 5-minute chart and what to expect today Emini intraday market update Yesterday’s Emini setups Tim created the SP500 Emini chart from Al’s provided summary Here are several reasonable stop entry setups from yesterday. I show each buy entry with a green […]
Emini Bulls Strong Follow-through Wanted and for Bears to Give Up
Trading Update: Tuesday February 14, 2023 Emini pre-open market analysis Emini daily chart Emini 5-minute chart and what to expect today Yesterday’s Emini setups Tim created the SP500 Emini chart from Al’s provided summary Here are several reasonable stop entry setups from yesterday. I show each buy entry with a green rectangle and each sell […]
Emini Bears Want Second Leg Down to January 30 Low
Trading Update: Monday February 13, 2023 Emini pre-open market analysis Emini daily chart Emini 5-minute chart and what to expect today Emini intraday market update Friday’s Emini setups Tim created the SP500 Emini chart from Al’s provided summary Here are several reasonable stop entry setups from Friday. I show each buy entry with a green […]
Bitcoin Test de Ruptura a la MME de 20 semanas
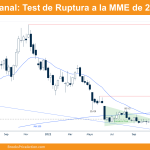
Visión de mercados: futuros sobre Bitcoin Los futuros sobre Bitcoin están realizando un test a la media móvil exponencial (MME) de 20 semanas tras romperlas previamente al alza. Durante la semana, el precio de Bitcoin ha bajado un +7.28 % respecto a la semana anterior. Bitcoin futuros Gráfico semanal de los futuros sobre Bitcoin Análisis Trading Gráfico […]
Emini Bear Doji Pullback
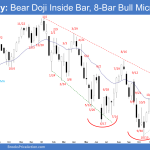
Market Overview: S&P 500 Emini Futures The S&P 500 Emini futures was a bear doji pullback on the weekly chart. The bulls have an 8-bar bull micro channel which may be broken soon. However, the first breakout below such a strong micro channel often is minor. The bears want a reversal lower from a higher […]
Crude Oil 12-Week Trading Range
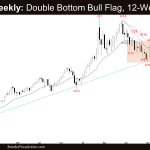
Market Overview: Crude Oil Futures The Crude oil futures is in a 12-week trading range on the weekly chart. Poor follow-through and reversals are more likely within a trading range. Traders will BLSH (Buy Low, Sell High) until there is a breakout from either direction. Markets have inertia and tend to continue to do what […]
EURUSD Consecutive Bear Bar
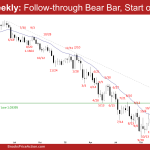
Market Overview: EURUSD Forex EURUSD consecutive bear bar on the weekly chart. It is the start of the pullback. The first targets for the bears are the 20-week exponential moving average and the January 6 low. The bulls want any pullback to be sideways and not deep. They want weak bear bars with long tails […]

