Trading Update: Friday December 16, 2022 Emini pre-open market analysis Emini daily chart Emini 5-minute chart and what to expect today Emini Morning Update: Yesterday’s Emini setups Al created the SP500 Emini charts. Here are several reasonable stop entry setups from yesterday. I show each buy entry with a green rectangle and each sell entry […]
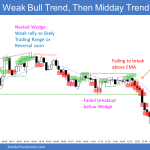
Emini Bears Want Second Leg Down
Trading Update: Thursday December 15, 2022 Emini pre-open market analysis Emini daily chart Emini 5-minute chart and what to expect today Yesterday’s Emini setups Al created the SP500 Emini charts. Here are several reasonable stop entry setups from yesterday. I show each buy entry with a green rectangle and each sell entry with a red […]
Emini Could Test 4,000 after FOMC Report Today
Trading Update: Wednesday December 14, 2022 Emini pre-open market analysis Emini daily chart Emini 5-minute chart and what to expect today Yesterday’s Emini setups Al created the SP500 Emini charts. Here are several reasonable stop entry setups from yesterday. I show each buy entry with a green rectangle and each sell entry with a red […]
Emini Surprise 130-point Breakout During Globex Session
Trading Update: Tuesday December 13, 2022 Emini pre-open market analysis Emini daily chart Emini 5-minute chart and what to expect today Yesterday’s Emini setups Al created the SP500 Emini charts. Here are several reasonable stop entry setups from yesterday. I show each buy entry with a green rectangle and each sell entry with a red […]
Emini Likely Sideways into Year End
Trading Update: Monday December 12, 2022 Emini pre-open market analysis Emini daily chart Emini 5-minute chart and what to expect today Friday’s Emini setups Al created the SP500 Emini charts. Here are several reasonable stop entry setups from Friday. I show each buy entry with a green rectangle and each sell entry with a red […]
Emini Start of Pullback from Wedge Bear Flag?
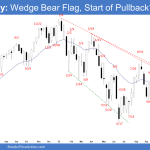
Market Overview: S&P 500 Emini Futures The S&P 500 Emini futures bears hope that this week is the Emini start of pullback from the wedge bear flag. The weekly candlestick closed below last week’s low and the 20-week exponential moving average. They need to create a follow-through bear bar to increase the odds of lower prices. The […]
Crude Oil Breakout below Trading Range and Bull Trend Line
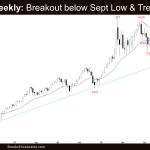
Market Overview: Crude Oil Futures Crude oil futures weekly candlestick was a breakout below trading range and the bull trend line closing near its low. The bears want a measured move down using the height of the September to November trading range which will take them to around $56. The bulls want a failed breakout below […]
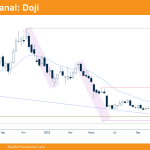
EURUSD Doji Bar at Bear Trend Line
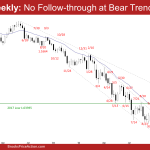
Market Overview: EURUSD Forex The EURUSD Forex traded higher but closed as a EURUSD doji bar at bear trend line. The bulls did not get follow-through buying. The bull needs to break far above the major bear trend line to increase the odds that the selloff has ended. The parabolic wedge increases the odds that we will […]
Bitcoin cotizando en lateral
Visión de mercado: Bitcoin Los futuros sobre bitcoin han cotizado en lateral durante la semana. El patrón alcista de bandera final activado hace un par de semanas sigue vigente, mientras el precio se encuentra dentro de un canal bajista. Bitcoin El gráfico semanal de los futuros sobre Bitcoin El gráfico diario de los futuros sobre […]
FTSE 100 Bear Inside Bar and Micro DT
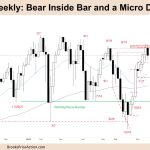
Market Overview: FTSE 100 Futures The FTSE futures market was a FTSE 100 bear inside bar and micro double top. It was a pause at 2 measured move targets and a possible double top. But the bull leg is very strong, and with so much urgency, bulls could not even buy below bars. It is likely […]

