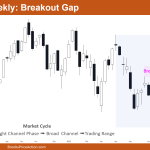
Market Overview: Nifty 50 Futures Nifty 50 futures breakout gap on the weekly chart confirmed by forming consecutive bull bars near the top of the developing trading range, which is more likely to get converted to an exhaustion gap. On the daily chart, the market formed a triangle late in the trend, and also there […]
DAX 40 Breakout Test of the Prior Trading Range
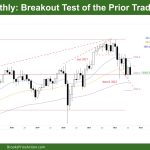
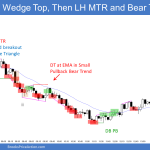
Market Overview: DAX 40 Futures DAX futures reversed strongly closing on the lows so it’s a sell signal on the monthly chart. It’s a DAX 40 breakout test of the prior trading range of January 2021. The bears want a move back into that range, a failed wedge bottom. The bulls see support at the […]
Emini bulls want strong entry bar today
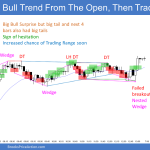
Trading Update: Friday September 2, 2022 Emini pre-open market analysis Emini daily chart The bears began taking partial profits yesterday, and the bulls started to buy for scalps. Bulls want strong entry bar today. The market reached the July 8 breakout point where there were buyers. Most breakout points are eventually tested; this is because […]
EURUSD breaks below 7-year trading range
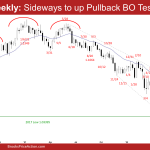
The EURUSD Forex July candlestick was a big bear bar with a long tail below. It broke below the 7-year trading range low. The long tail below indicates that the bears are not as strong as they could have been. The bears will need to create a consecutive bear bar to confirm the breakout below the 7-year trading range. The selling has been climactic. The trend channel line overshoot and wedge bottom (November 24, May 13 and July 14) increase the odds of at least a small sideways to up pullback (for a couple of weeks) before the EURUSD continue lower. The pullback may have begun in July.
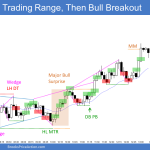
Dax 40 bull bar at prior breakout point
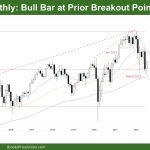
Market Overview: DAX 40 Futures DAX futures was a bull bar at a prior breakout point. It’s always in short on the monthly chart and weekly but with consecutive bull bars at prior breakout points on the weekly we might go sideways. It is a low probability buy for the bulls and it’s selling low […]
Emini bulls want breakout to reach June high
Trading Update: Monday July 25, 2022 Emini pre-open market analysis Emini daily chart The bulls broke above the neckline (June 28) of the double bottom (July 14) last week. Bulls want breakout to lead to a measured move up and test of the June 2nd major low or high. The measured move from the July […]
Nasdaq 100 bull breakout attempt
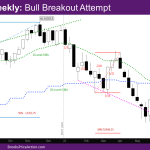
Market Overview: NASDAQ 100 Emini Futures NASDAQ 100 bull breakout attempt above the tight trading range (TTR) that has been going on for the last 4 weeks. The week closed with a bull body, but a big tail at the top and bottom. We have been saying for a couple of weeks now that prices […]
Emini strong breakout above neckline of double bottom
Trading Update: Friday July 22, 2022 Emini pre-open market analysis Emini daily chart The bulls have done a great job getting consecutive bull closes above the June 28 high this week. This will likely lead to a successful bull breakout above neckline (June 28) of the double bottom (June 30 and July 14). Bulls want […]
Emini bulls want breakout above neckline of double bottom
Trading Update: Monday July 18, 2022 Emini pre-open market analysis Emini daily chart Bulls had a strong entry bar following last Thursday’s (July 14) double bottom high low major trend reversal signal bar. The strong follow-through last Friday increases the odds of higher prices. The bulls hope this is the rally that will lead to […]
EURUSD bear breakout below 2017 low
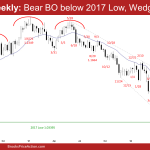
The EURUSD Forex weekly candlestick broke out below the 7-year trading range. Bears want a measured move down based on the 7-year trading range height which will take them to the year 2000 low. Bulls want a failed breakout below the trading range and hope that the 10-week trading range is the final flag of the whole move down since 2021.

