
Al Brooks and Ali Moin Afshari are holding a 4-day workshop in Orlando, Florida, on Saturday June 1 through Tuesday June 4, 2024. See location info at the bottom. We have continued to receive requests from traders all over the world to hold such live events and we expect event to be sold out quickly. […]
Al Brooks Live Trading Workshop Orlando,
Emini Second Leg Up Likely
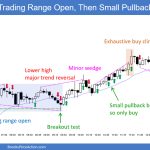
Trading Update: Tuesday May 7, 2024 S&P Emini pre-open market analysis Emini daily chart Emini 5-minute chart and what to expect today Emini Intra-Day Update Yesterday’s Emini setups Al created the SP500 Emini charts. Here are reasonable stop entry setups from yesterday. I show each buy entry bar with a green arrow and each sell […]
Emini Bull Breakout of Bear Flag
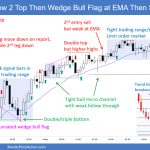
Trading Update: Monday May 6, 2024 S&P Emini pre-open market analysis Emini daily chart Emini 5-minute chart and what to expect today Emini Intra-Day Update Friday’s Emini setups Al created the SP500 Emini charts. Here are reasonable stop entry setups from Friday. I show each buy entry bar with a green arrow and each sell […]
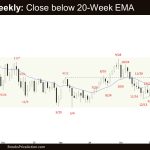
Bitcoin April Bear Bar, Bulls Fight Back at 20-Week EMA
Market Overview: Bitcoin After a year of remarkable highs, Bitcoin appears to be facing a significant crossroads. The April monthly candle tells a tale of fading bullish momentum, closing near its lows after a failed breakout above the previous all-time high. The weekly chart highlights a limit order market, where bulls are attempting to find […]
Sideways EURUSD Trading Range
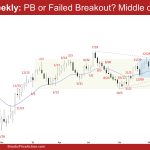
Market Overview: EURUSD Forex The market is forming a sideways EURUSD trading range on the monthly chart. The middle of the trading range is an area of balance. Traders will BLSH (Buy Low, Sell High) until there is a breakout with sustained follow-through buying/selling from either direction. Poor follow-through and reversals are hallmarks of a trading range. […]
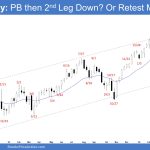
Crude Oil Lower High
Market Overview: Crude Oil Futures The monthly chart formed a Crude Oil lower high in April. The bears want April to reverse back below the 20-month EMA and form a second leg sideways to down to retest the December low from a lower high major trend reversal (Apr 12). The bulls hope that the current sideways-to-down move is simply […]
Minor Emini Pullback
Market Overview: S&P 500 Emini Futures The weekly chart is forming a minor Emini pullback. The bulls want a strong retest of the March 21 high followed by a strong breakout above, starting the larger bull channel phase. The bears want at least a small second leg sideways to down after a pullback. If the market trades higher, they want a […]
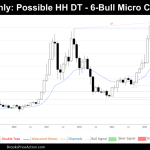
Nifty 50 Bull Micro Channel
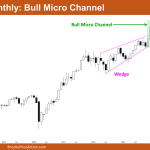
Market Overview: Nifty 50 Futures Nifty 50 Bull Micro Channel on the monthly chart. This month, the market closed with a weak bullish pattern, showing a small body and a tail at the bottom. Currently, on the monthly chart, the market is experiencing a breakout phase because of the bullish breakout of the wedge top. […]
Nasdaq 100 First Pullback since October 2023
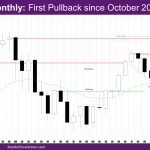
Market Overview: NASDAQ 100 Emini Futures The NASDAQ Emini futures April monthly candlestick is a big bear bar with a prominent tail below. It is the first pullback since October 2023. The week is a bull doji bar with a long tail below. The long tail below is likely the 2nd leg for now corresponding […]
DAX 40 Bear Outside Bar, in Tight Bull Channel
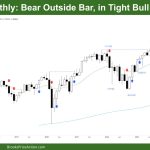
Market Overview: DAX 40 Futures DAX futures went lower last month with a bear outside bar closing on its midpoint. It is sideways after a strong bull spike and possibly two legs up. It could be time for a correction, but without a decent sell signal, it might transition into a broader channel instead. DAX […]
FTSE 100 Always In Long, ATH, Top of TR
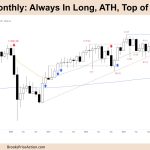
Market Overview: FTSE 100 Futures The FTSE 100 futures went always in long last month with consecutive bull bars closing above the moving average. We left the wedge bottom and broke to the upside, so most bears got out of the way. It is a trading range, so most gaps should close, and pullbacks can […]