Trading Update: Tuesday August 20, 2024 S&P Emini market analysis Emini daily chart Emini 5-minute chart and what to expect today Yesterday’s Emini setups Al created the SP500 Emini charts. Here are reasonable stop entry setups from yesterday. I show each buy entry bar with a green arrow and each sell entry bar with a […]
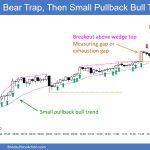
Emini Bull Microchannel Likely to End Today
Trading Update: Monday August 19, 2024 S&P Emini market analysis Emini daily chart Emini 5-minute chart and what to expect today Friday’s Emini setups Al created the SP500 Emini charts. Here are reasonable stop entry setups from Friday. I show each buy entry bar with a green arrow and each sell entry bar with a […]
Bitcoin inside bar after reversal up from wedge bull flag at $50000
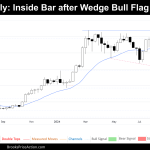
Market Overview: Bitcoin Bitcoin reflects a period of sideways trading that following a significant move, as the market navigates through a tight range after last week’s $10,000 weekly candlestick. This sideways movement is typical after such a large price move, as the market takes time to digest the increased risk. The weekly chart suggests the […]
Weekly EURUSD Breakout
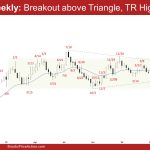
Market Overview: EURUSD Forex The market formed a weekly EURUSD breakout above the triangle. The bulls need to create more follow-through bull bars following this week’s breakout to increase the odds of testing the July 18, 2023, high. The bears want a reversal from a large wedge bear flag (Mar 8, Jun 4, and Aug […]
Weekly Crude Oil Lower High
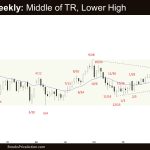
Market Overview: Crude Oil Futures The market formed a weekly Crude Oil lower high. The bears must create a strong entry bar to increase the odds of retesting the August 5 low and the triangle bottom. The bulls hope that this week was simply a pullback and want at last a small retest of the […]
Strong Emini Consecutive Bull Bars
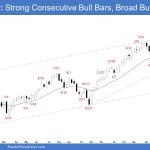
Market Overview: S&P 500 Emini Futures The weekly chart formed a strong Emini consecutive bull bars closing near their highs. The bulls want a retest of the all-time high and a resumption of the broad bull channel. The bears want a reversal from a lower high major trend reversal or a double top bear flag […]
Nifty 50 High-1
Market Overview: Nifty 50 Futures Nifty 50 High-1 signal bar’s high has been breached this week. The market this week closed with a strong bullish momentum. The bull bar closed near its high with only a short tail at the bottom. Bears once again failed to produce a bear bar, reducing the likelihood of a […]
Nasdaq 100 Strong Entry Bar to Weak Buy Signal Bar of 8-9
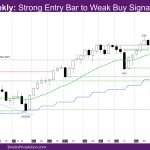
Market Overview: NASDAQ 100 Emini Futures The NASDAQ Emini futures week is a bull trend bar with the exponential moving average (EMA) around its midpoint. It is a strong entry bar to weak buy signal bar of 8-9. Note – This should say week of 8-5 and is referring to the prior week. On the […]
DAX 40 Bull Breakout & FT, Back to 18500 TTR
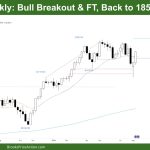
Market Overview: DAX 40 Futures DAX futures went higher last week with a strong bull breakout closing on its high and above the moving average. Back to the TTR at 18500 area. It was the first close below the MA so bulls bought it and lower. We might start to go sideways here in this […]
FTSE 100 Expanding Triangle, Buy Signal Above MA
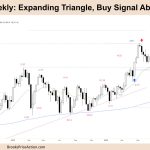
Market Overview: FTSE 100 Futures FTSE 100 futures went higher with a bull bar in an expanding triangle. Tight trading ranges in trends are generally continuation patterns, so traders expect more up. But the bears have been scalping. So it will need a strong follow-through bar this week to convince traders it is back to […]

