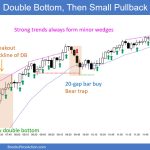
Trading Update: Friday August 16, 2024 S&P Emini market analysis Emini daily chart Emini 5-minute chart and what to expect today Yesterday’s Emini setups Al created the SP500 Emini charts. Here are reasonable stop entry setups from yesterday. I show each buy entry bar with a green arrow and each sell entry bar with a […]
Emini Bears Giving Up Interest in Selling Higher
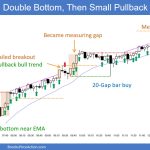
Trading Update: Thursday August 15, 2024 S&P Emini market analysis Emini daily chart Emini 5-minute chart and what to expect today Yesterday’s Emini setups Al created the SP500 Emini charts. Here are reasonable stop entry setups from yesterday. I show each buy entry bar with a green arrow and each sell entry bar with a […]
Emini Strong Bull Micro Channel at Resistance
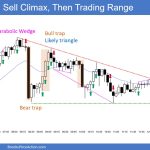
Trading Update: Wednesday August 14, 2024 S&P Emini market analysis Emini daily chart Emini 5-minute chart and what to expect today Yesterday’s Emini setups Al created the SP500 Emini charts. Here are reasonable stop entry setups from yesterday. I show each buy entry bar with a green arrow and each sell entry bar with a […]
Emini Resistance at Daily Moving Average and 5,400 Round Number
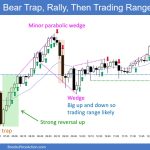
Trading Update: Tuesday August 13, 2024 S&P Emini pre-open market analysis Emini daily chart Emini 5-minute chart and what to expect today Yesterday’s Emini setups Al created the SP500 Emini charts. Here are reasonable stop entry setups from yesterday. I show each buy entry bar with a green arrow and each sell entry bar with […]
Emini Sellers at Daily Moving Average
Trading Update: Monday August 12, 2024 S&P Emini pre-open market analysis Emini daily chart Emini 5-minute chart and what to expect today Friday’s Emini setups Al created the SP500 Emini charts. Here are reasonable stop entry setups from Friday. I show each buy entry bar with a green arrow and each sell entry bar with […]
Bitcoin Wedge Bottom at the BOP and $50000
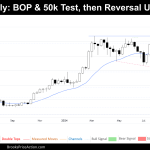
Market Overview: Bitcoin Bitcoin’s recent weekly chart unveils a market entrenched in a trading range, marked by notable bullish resilience. At Monday’s close, bears appeared poised to establish an EMA gap bar, signaling potential downward momentum. However, bulls thwarted this move once again, indicating that a definitive major top has yet to materialize. This persistent […]
No Weekly EURUSD Breakout
Market Overview: EURUSD Forex So far, there is no weekly EURUSD breakout above the triangle pattern. The bulls hope this week was a pullback and want the market to break out above the triangle again. The bears want a reversal from around the top of the triangle pattern and the bear trend line to act […]
Crude Oil Double Bottom Bull Flag
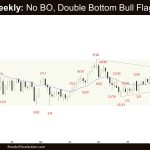
Market Overview: Crude Oil Futures The market formed a Crude Oil double bottom bull flag on the weekly chart. If there is a pullback (bounce), the bears want at least a small second leg sideways to down to retest the current leg low (now Aug 5). The bulls want a reversal from a double bottom […]
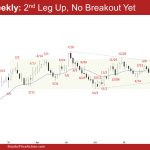
Weekly Emini Double Bottom Bull Flag
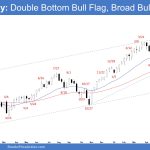
Market Overview: S&P 500 Emini Futures The market formed a weekly Emini double bottom bull flag (Apr 19 and Aug 5). The bulls want a reversal from a double bottom bull flag (Apr 19 and Aug 5) and hope to get a small retest of the all-time high, even if it only forms a lower […]
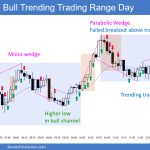
Nifty 50 Big Round Number 25000
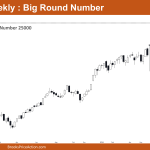
Market Overview: Nifty 50 Futures Nifty 50 Big Round Number 25000. This week, the market closed bullish with a small body and a short wick at the bottom. Bears attempted but failed to sustain consecutive strong bearish bars, indicating a prevailing bullish trend. Currently, the market shows signs of forming a micro wedge bottom, suggesting […]

