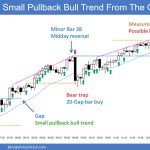
Trading Update: Thursday February 8, 2024 S&P Emini pre-open market analysis Emini daily chart Emini 5-minute chart and what to expect today Yesterday’s Emini setups Al created the SP500 Emini charts. Here are reasonable stop entry setups from yesterday. I show each buy entry bar with a green arrow and each sell entry bar with […]
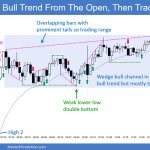
Emini Likely to Reach 5,000 Today
Trading Update: Wednesday February 7, 2024 S&P Emini pre-open market analysis Emini daily chart Emini 5-minute chart and what to expect today Yesterday’s Emini setups Al created the SP500 Emini charts. Here are reasonable stop entry setups from yesterday. I show each buy entry bar with a green arrow and each sell entry bar with […]
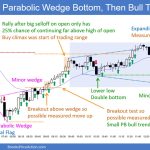
Emini Inside Bar below Support
Trading Update: Tuesday February 6, 2024 S&P Emini pre-open market analysis Emini daily chart Emini 5-minute chart and what to expect today Yesterday’s Emini setups Al created the SP500 Emini charts. Here are reasonable stop entry setups from yesterday. I show each buy entry bar with a green arrow and each sell entry bar with […]
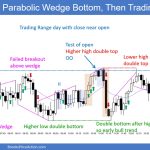
Emini Testing 5,000 Round Number
Trading Update: Monday February 5, 2024 S&P Emini pre-open market analysis Emini daily chart Emini 5-minute chart and what to expect today Friday’s Emini setups Al created the SP500 Emini charts. Here are reasonable stop entry setups from Friday. I show each buy entry bar with a green arrow and each sell entry bar with […]
Bitcoin Double Top with 2022 High on the Monthly Chart
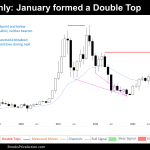
Market Overview: Bitcoin Throughout the week, there was the closure of the Bitcoin Monthly candlestick, a pivotal event for market participants. Institutions traditionally regard the month of January as a barometer for gauging market trends and sentiment for the remainder of the year. The price action witnessed a shift as Bitcoin closed below the December […]
EURUSD Trading Range
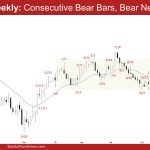
Market Overview: EURUSD Forex The monthly chart formed a EURUSD trading range closing as an inside bear bar. The bears need to create a follow-through bear bar closing below the 20-month EMA to increase the odds of reaching the October low. The bulls want the 20-month EMA to act as support. EURUSD Forex market The […]
Crude Oil Trading Range
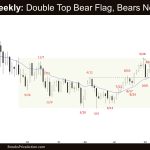
Market Overview: Crude Oil Futures The monthly chart is forming a Crude Oil trading range. The bulls want a reversal from a higher low major trend reversal and a double bottom bull flag (May 4 and Dec 13). The bears see January simply as a pullback and want a second leg sideways to down. They […]
Emini Test All-Time High
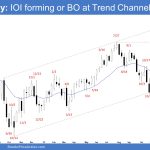
Market Overview: S&P 500 Emini Futures The monthly chart is forming an Emini test all-time high. The bulls hope that the market will reach the all-time high and break out above. The bears want a reversal from a lower high major trend reversal or a double top and a large wedge pattern (Dec 2, July […]
Nifty 50 Inside Bar
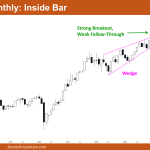
Market Overview: Nifty 50 Futures Nifty 50 Inside Bar on the monthly chart. On the monthly chart, Nifty 50 closed weakly bullish with a very small body. Despite this, the market remains in the breakout phase since the bull breakout of the wedge top pattern. However, due to the lack of strong follow-through, there’s a […]
Nasdaq 100 January 2024 Is a Bull Doji Bar
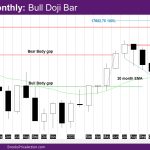
Market Overview: NASDAQ 100 Emini Futures The NASDAQ Emini futures January monthly candlestick has a close that is higher than the December 2023 close but lower than the Nov 2021 close. January 2024 is a bull doji bar with a tail above and below. The week is a bull H1 reversal bar with a tail […]

