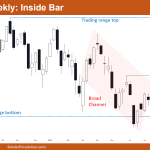
Market Overview: Nifty 50 Futures Nifty 50 futures inside bar on the weekly chart after a bear breakout below a higher high double top neckline. Bears would be exiting now and bulls would be buying, so traders would be expecting one leg up. Nifty 50 on the daily chart is forming a breakout triangle (a […]
Nasdaq 100 Bear Breakout Attempt below June Low
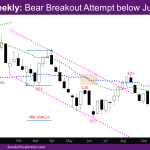
Market Overview: NASDAQ 100 Emini Futures The NASDAQ Emini futures market is attempting a Nasdaq 100 bear breakout below the June low. It fell far below the prior June low this week and closed far below it as well, although with a tail below. Last week’s bar was a doji with a big tail above. […]
DAX 40 Breakout Mode, Bull Inside Bar
Market Overview: DAX 40 Futures DAX futures moved sideways last week with a weekly bull inside bar. It’s a micro double top and bottom, DAX 40 breakout mode so next week is important. Probability favors the bear move down, but the math favors the bulls for a swing up to the moving average. We are […]
FTSE 100 Bear Channel Closing below Big Round Number
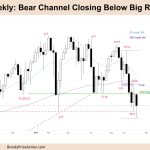
Market Overview: FTSE 100 Futures The FTSE futures market moved sideways to down last week in a FTSE 100 bear channel with another bear bar. Limit bulls bought below the outside bar and the strong reversal on Friday will scare some bears off selling too low again. We are always in short so high probability we […]
Emini Bulls Follow-through Needed Today
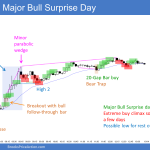
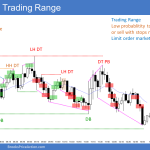
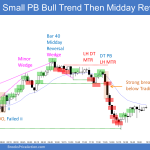
Trading Update: Friday October 14, 2022 Emini pre-open market analysis Emini daily chart Yesterday was a very good day for the bulls, with follow-through needed today, which might be the year’s low. While the odds favor a second leg up yesterday’s bull breakout, the bar is so climactic that the market may have to pull […]
Al Brooks Live Trading Workshop Orlando, October 25 – 27, 2022

To help meet the strong demand for Al Brooks to engage in live trading events, Al is holding a 3-day workshop in Orlando, Florida, on Tuesday October 25th through Thursday October 27th, 2022. We have been inundated with requests from traders all over the world to hold such events and we are expecting the event will […]
Emini Bears Downside Breakout Overnight
Trading Update: Thursday October 13, 2022 Emini pre-open market analysis Emini daily chart Emini bears downside breakout overnight, and bears now have a 6-bar bear micro channel. The market is beginning to collect bear bars closing below midpoints under the June 17 low. The bulls keep trying to reverse the market up but failing. This […]
Emini Bulls Want Strong Buy Signal Bar Today
Trading Update: Wednesday October 12, 2022 Emini pre-open market analysis Emini daily chart The bulls tried to get a strong buy signal bar closing on its high yesterday after failing to break below the September 30 low. However, the market reversed down late yesterday, forming a doji bar. The bulls want strong buy signal bar […]
Emini Bulls Want to End Bear Streak
Trading Update: Tuesday October 11, 2022 Emini pre-open market analysis Emini daily chart The bears were able to get a follow-through yesterday after Friday’s big bear breakout. Bulls want to end bear streak. However, yesterday closed around its midpoint instead of on its low. This is a sign of weakness by the bears, and the […]
Emini Bears Likely Disappointment Today
Trading Update: Monday October 10, 2022 Emini pre-open market analysis Emini daily chart Last Friday, the bears did a great job reversing the bull breakout that began early last week. While the bears want follow-through, bears likely disappointment today. The bears hope this is the start of the move that will break far below the […]

