
This page is restricted for Brooks Trading Course members only. Please log in to view content. Username or E-mail Password Remember Me Forgot Password
Bar counting

This page is restricted for Brooks Trading Course members only. Please log in to view content.
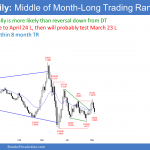
Emini traders expect small break above April nested wedge
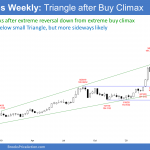
Market Overview: Weekend Market Update The Emini reversed down from a nested wedge top on the daily chart a week ago. However, this week rallied strongly and it is testing the top of the wedge. It will probably trigger the buy signal on the monthly chart before there is a pullback to 2600. The near-term […]
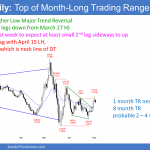
Emini forming likely lower high after April nested wedge top
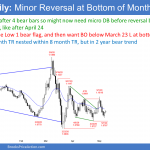
Emini and Forex Trading Update:Friday May 8, 2020 I will update again at the end of the day. Pre-Open market analysis Yesterday gapped up and formed a trading range day. The bulls want a break above the April high. It is very important on the daily, weekly, and monthly charts. Since April is a High […]
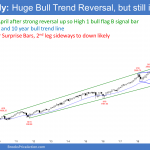
Emini still sideways after April nested wedge top
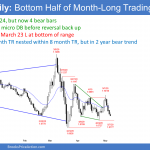
Emini and Forex Trading Update:Thursday May 7, 2020 I will update again at the end of the day. Pre-Open market analysis The Emini yesterday traded below Tuesday’s low. That triggered a sell signal on the daily chart. This week triggered a minor sell signal on the weekly chart when Monday traded below last week’s low. […]
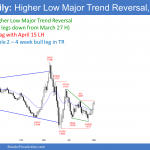
Emini May rally but likely lower high
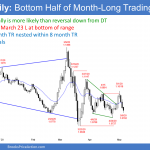
Emini and Forex Trading Update:Wednesday May 6, 2020 I will update again at the end of the day. Pre-Open market analysis The Emini rallied yesterday, but reversed down from around the 20 week EMA. Yesterday’s candlestick is a Low 1 sell signal bar for today. However, it was only a doji bar on the daily […]
Emini minor sell signal in May at 20 week EMA
Emini and Forex Trading Update:Tuesday May 5, 2020 I will update again at the end of the day. Pre-Open market analysis The Emini traded below last week’s low yesterday. That triggered a minor sell signal on the weekly chart. But since there is a 6 bar bull micro channel, the reversal down should be minor. […]
Emini April nested wedge top is minor sell signal
Emini and Forex Trading Update:Monday May 4, 2020 I will update again at the end of the day. Pre-Open market analysis The Emini reversed down last week from a nested wedge top on the daily chart. This is probably the start of a 2 – 3 week pullback to around 2600. Since the 6 week […]
Emini nested wedge buy climax in April but minor monthly buy signal
Market Overview: Weekend Market Update The Emini is turning down from a nested wedge rally on the daily chart. This week is a good candidate for the start of a 2 – 3 week pullback. The bond futures market has been sideways for 8 weeks after an extreme buy climax. It will probably be in […]
Emini April rally has nested wedge buy climaxes at resistance
Emini and Forex Trading Update:Friday May 1, 2020 I will update again at the end of the day. Pre-Open market analysis The Emini reversed down yesterday, but was sideways for most of the day. There is a wedge buy climax on the 60 minute chart. It is nested within a bigger wedge buy climax on […]

