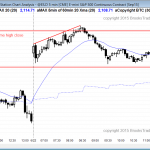
Posted 7:25 a.m. The Emini gapped up and had an opening reversal up from a brief selloff to test yesterday’s high. However, the rally has not been strong. Whenever there is a big gap, the Emini usually goes sideways for an hour or two until it gets closer to the moving average, and then it […]
Intraday market update: June 22, 2015
Ask Al: Brooks Trading Course update
BPA trading room Q&A: April 21, 2015 When are you planning on releasing new videos for your trading course? Can you discuss what it will cover?Audio duration: 5min 36sec — Scroll down for video slide samples and transcript. Brooks Trading Course update Video slide samples – No audio narration (4min 20sec) This video is […]
Emini weekend update: June 20, 2015:
Learn how to trade the markets in a buy climax
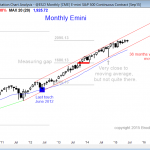
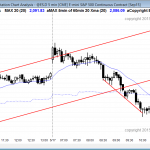
Monthly S&P500 Emini futures candlestick chart: Strong bull trend, but overbought The monthly S&P500 Emini futures candlestick chart is in an overbought bull trend and the odds favor a test of the moving average over the next few months. The monthly S&P500 Emini futures candlestick chart is exceptionally overbought and it has an 80% chance […]
Intraday market update: June 19, 2015
Day trading strategies at the top of the range
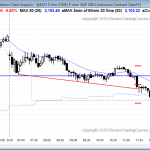
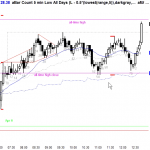
Posted 8:39 a.m. The Emini opened with a trading range just below the moving average and just above the high of last week. This is a breakout mode open, and a limit order market for scalpers. Most day traders should wait for a strong breakout with follow-through up or down. The swing trade should go […]
Intraday market update: June 18, 2015
Learn how to swing trade
Posted 7:04 a.m. The Emini began with a trend from the open bull trend. However, it might be forming a parabolic wedge top near last week’s high. If there is a strong sell signal bar after the 3rd push up, swing bears will sell. Bears wanting a higher probability short will wait for a strong […]
Intraday market update: June 17, 2015
Day trading tip for an FOMC report
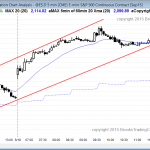
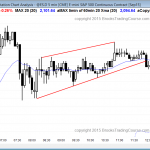
Posted around 7:33 a.m. The Emini opened above the bull channel of the past 2 days, which is a type of buy climax. There is a 75% chance that a bull breakout above a bull channel will fail within about 5 bars and then go sideways to down to the bottom of the channel. The […]
Intraday market update: June 16, 2015
Neutral candlestick pattern on the daily chart
Posted 7:21 a.m. The bulls got a strong breakout above yesterday’s tight trading range, but the rally lasted one bar and stalled at the 60 minute moving average, Friday’s low (the top of the gap on the daily chart), and at the leg 1 = leg 2 target based on yesterday’s early strong bull breakout. […]
Ask Al: How did you develop your trading edge?
BPA trading room Q&A: May 14, 2015 How did you develop your trading edge? (Plus follow up related comments by Al on topic a week later.) Audio duration: 2min 49sec — Scroll down for images Audio transcript Al’s most important trading edge That is a question that I could talk about forever, and the […]
Emini weekend update: June 13, 2015:
Learn how to trade the markets in breakout mode

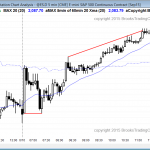
Monthly S&P500 Emini futures candlestick chart: Strong bull trend, but buy climax The monthly S&P500 Emini futures candlestick chart is in a small pullback bull trend with no sign of a top, but since this is 36 months without touching the moving average and that is historically unusual, a reversal down to below the moving […]
Intraday market update: June 11, 2015
Learn how to trade a strong breakout
Posted 7:07 a.m. The bulls tried for bull trend resumption on the open, but the rally was weak. Also, yesterday’s 5 hour tight trading range after a buy climax is a possible final flag. It is an area where bulls and bears agreed that the price was fair. The bulls need to break strongly above […]

