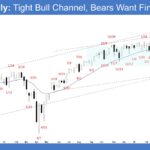
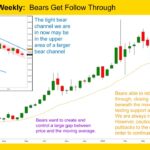
Market Overview: S&P 500 E-mini Futures The market formed an E-mini spike and bull channel in the last 8 weeks. Bulls want any pullback to be weak and sideways, lacking follow-through, with overlapping candlesticks and prominent lower tails. Bears need to generate strong bear bars breaking below the minor bull trend line to indicate strength. […]
Nifty 50 Converging Triangle and Tight Ranges
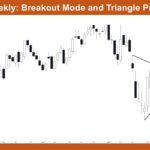
Market Overview: Nifty 50 Futures Nifty 50 Converging Triangle and Tight Ranges. On the weekly chart, Nifty 50 is forming a contracting triangle after a deep bear swing from all-time highs near 26,200 down to approximately 22,100, with the upper trend line descending and the lower trend line ascending, compressing price into a narrowing range. […]
Nasdaq 100 High 1 Buy Signal After 5-11 Bear Doji
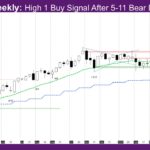
Market Overview: NASDAQ 100 E-mini Futures The NASDAQ E-mini futures week is a High 1 buy signal after 5-11 bear doji. Bulls bought below the low of last week. The daily chart still does not have good follow-through bear bars. The monthly bar is a good follow-through bull trend bar to the biggest bull trend […]
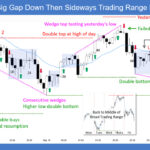
Gold Bears Maintain Control and Test Support
Gold GC-Mini Market Analysis The Gold GC-mini has been gradually weakening for the past 4 months, despite strong pushes by bulls. The weekly chart shows follow through for the bears though unable to break out to the downside, with a large tail beneath. The weekly bar is a bear doji bar which is a trading […]
E-mini: Buyers on the First Test of the Moving Average
Trading Update: Friday May 22, 2026 E-mini end of day video review S&P E-mini market analysis E-mini daily chart E-mini 5-minute chart and what to expect today Yesterday’s E-mini setups Richard created the SP500 E-mini chart. Here are reasonable stop entry setups from yesterday. Chart shows each buy entry bar with a green arrow and […]
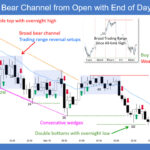
E-mini Bulls Reverse Up at the Moving Average, but Upside Limited
Trading Update: Thursday May 21, 2026 E-mini end of day video review S&P E-mini market analysis E-mini daily chart E-mini 5-minute chart and what to expect today Yesterday’s E-mini setups Richard created the SP500 E-mini chart. Here are reasonable stop entry setups from yesterday. Chart shows each buy entry bar with a green arrow and […]
E-mini Implied Two-Legged Pullback to Moving Average
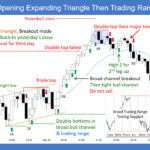
Trading Update: Wednesday May 20, 2026 E-mini end of day video review S&P E-mini market analysis E-mini daily chart E-mini 5-minute chart and what to expect today Yesterday’s E-mini setups Richard created the SP500 E-mini chart. Here are reasonable stop entry setups from yesterday. Chart shows each buy entry bar with a green arrow and […]
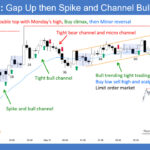
E-mini Daily: Climactic Rally Likely to Test Moving Average
Trading Update: Tuesday May 19, 2026 E-mini end of day video review S&P E-mini market analysis E-mini daily chart E-mini 5-minute chart and what to expect today Yesterday’s E-mini setups Richard created the SP500 E-mini chart. Here are reasonable stop entry setups from yesterday. Chart shows each buy entry bar with a green arrow and […]
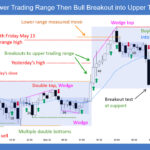
E-mini Tight Bull Channel Likely to Test Moving Average
Trading Update: Monday May 18, 2026 E-mini end of day video review S&P E-mini market analysis E-mini daily chart E-mini 5-minute chart and what to expect today Friday’s E-mini setups Richard created the SP500 E-mini chart. Here are reasonable stop entry setups from Friday. Chart shows each buy entry bar with a green arrow and […]
Bitcoin 6-week Bull Micro Channel Ends

Market Video Report: Bitcoin Duration 24:17 mins. Summary Bitcoin price action shows a weekly bear reversal, breaking a bull micro channel after shifting the short-term market direction to “always in long”. The analysis expects a “second leg” up, magnetized by the $90,000 level. Traders initiating long trades may use smaller position sizes and be prepared […]

