Gold GC-Mini Market Analysis The Gold GC-mini was no longer divergent with the S&P 500 and Nasdaq markets this week, with all 3 markets putting in strong bear bars. Gold is steadily moving further away from the psychological 5000 mark. This means that the path of least resistance is down, and the probability of making […]
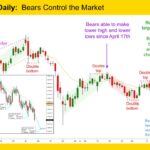
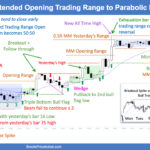
E-mini Testing Daily Moving Average
Trading Update: Friday June 5, 2026 E-mini end of day video review S&P E-mini market analysis E-mini daily chart E-mini 5-minute chart and what to expect today Yesterday’s E-mini setups Jed created the SP500 E-mini chart. Here are reasonable stop entry setups from yesterday. Chart shows each buy entry bar with a green arrow and […]
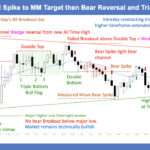
E-mini Buyers below Yesterday’s Reversal Down
Trading Update: Thursday June 4, 2026 S&P E-mini market analysis E-mini daily chart E-mini 5-minute chart and what to expect today Yesterday’s E-mini setups Jed created the SP500 E-mini chart. Here are reasonable stop entry setups from yesterday. Chart shows each buy entry bar with a green arrow and each sell entry bar with a […]
E-mini Bulls Taking Profits Betting on Pullback
Trading Update: Wednesday June 3, 2026 E-mini end of day video review S&P E-mini market analysis E-mini daily chart E-mini 5-minute chart and what to expect today Yesterday’s E-mini setups Jed created the SP500 E-mini chart. Here are reasonable stop entry setups from yesterday. Chart shows each buy entry bar with a green arrow and […]
E-mini Unlikely to Close Above Globex Open
Trading Update: Tuesday June 2, 2026 S&P E-mini market analysis E-mini daily chart E-mini 5-minute chart and what to expect today Yesterday’s E-mini setups Jed created the SP500 E-mini chart. Here are reasonable stop entry setups from yesterday. Chart shows each buy entry bar with a green arrow and each sell entry bar with a […]
E-mini Sellers Likely at 7,600 Major Round Number
Trading Update: Monday June 1, 2026 S&P E-mini market analysis E-mini daily chart E-mini 5-minute chart and what to expect today Friday’s E-mini setups Jed created the SP500 E-mini chart. Here are reasonable stop entry setups from Friday. Chart shows each buy entry bar with a green arrow and each sell entry bar with a […]
Consecutive Strong Monthly E-mini Bull Bars
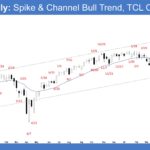
Market Overview: S&P 500 E-mini Futures The market formed consecutive strong monthly E-mini bull bars, breaking into new all-time highs. Bulls want a measured move to around 8000 based on the height of the April spike bar. Bears want a failed breakout above the bull trend channel line within a few months, followed by a […]
Bitcoin Monthly Bear Reversal within Buy Zone

Market Video Report: Bitcoin Duration 29:11 mins. Summary Bitcoin’s monthly and weekly charts suggest a fair value of $90,000. Although the long-term context favors buyers, the short-term momentum remains bearish with failed breakouts. Trading near these lows carries lower probability for shorts. Awaiting strong bullish structures like double bottoms is preferred. Transcript Hello everyone, and […]
EURUSD Inside Bar in the Middle of the Trading Range
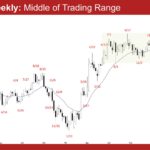
Market Overview: EURUSD Forex The market formed a EURUSD inside bar in the middle of the trading range on the monthly chart. Bulls want a retest of the January 27 high, followed by a strong breakout above. Bears need consecutive strong bear bars breaking below the 20-month EMA to show control. EURUSD Forex market The […]
Monthly Crude Oil ii Pattern
Market Overview: Crude Oil Futures The market formed a monthly Crude oil ii pattern (inside-inside). The market is in breakout mode. Bears want a breakout below the inside bear bar, while bulls want the breakout to fail and reverse up. Crude oil futures The Monthly crude oil chart The Weekly crude oil chart Market analysis […]

