Trading Update: Thursday June 11, 2026 S&P E-mini market analysis E-mini daily chart E-mini 5-minute chart and what to expect today Yesterday’s E-mini setups Jed created the SP500 E-mini chart. Here are reasonable stop entry setups from yesterday. Chart shows each buy entry bar with a green arrow and each sell entry bar with a […]
E-mini Buyers Near Yesterday’s Low
Trading Update: Wednesday June 10, 2026 E-mini end of day video review S&P E-mini market analysis E-mini daily chart E-mini 5-minute chart and what to expect today Yesterday’s E-mini setups Jed created the SP500 E-mini chart. Here are reasonable stop entry setups from yesterday. Chart shows each buy entry bar with a green arrow and […]
E-mini Buyers below Low of Last Week
Trading Update: Tuesday June 9, 2026 E-mini end of day video review S&P E-mini market analysis E-mini daily chart E-mini 5-minute chart and what to expect today Yesterday’s E-mini setups Jed created the SP500 E-mini chart. Here are reasonable stop entry setups from yesterday. Chart shows each buy entry bar with a green arrow and […]
E-mini Sell Vacuum Test of May 20 Higher Low
Trading Update: Monday June 8, 2026 S&P E-mini market analysis E-mini daily chart E-mini 5-minute chart and what to expect today Yesterday’s E-mini setups Jed created the SP500 E-mini chart. Here are reasonable stop entry setups from yesterday. Chart shows each buy entry bar with a green arrow and each sell entry bar with a […]
Bitcoin Suffers 20% Weekly Decline

Market Video Report: Bitcoin Duration 36:29 mins. Summary The report analyzes Bitcoin’s 20% drop, identifying the weekly bear bar as a sell climax within a major trading range. Although macro fair value remains around $90,000, immediate price action may favors a second leg lower. In this situations, investors should remain calm and traders should be […]
EURUSD Formed a Bear Leg Within the Trading Range
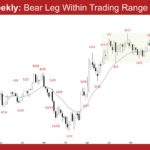
Market Overview: EURUSD Forex EURUSD formed a bear leg within the trading range. Bulls want the lower third of the trading range or the March 13 low area to provide support. Bears want a retest and breakout below the trading range low, followed by a measured move based on the height of the trading range. […]
Crude Oil Has Formed a Triangle Pattern
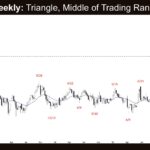
Market Overview: Crude Oil Futures Crude oil has formed a triangle pattern on the weekly chart over the past 13 weeks. Bulls want any pullback to form a higher low relative to the May 6 or April 17 lows. Bears see this week as a pullback and want a second leg sideways to down following […]
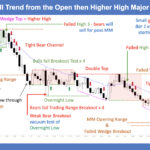
E-mini Bears Need Strong Follow-through Selling
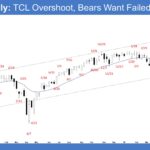
Market Overview: S&P 500 E-mini Futures On the weekly chart, E-mini bears need strong follow-through selling. Bears want a two-legged sideways-to-down pullback lasting a few weeks. Bulls see this week as a pullback and want at least a small sideways-to-up leg to retest the all-time high after the pullback, even if it only forms a […]
Nifty 50 Low-2 Short Opportunity
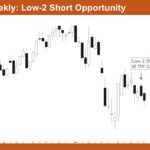
Market Overview: Nifty 50 Futures Nifty 50 Low-2 Short Opportunity. On the weekly chart, Nifty 50 is trading in a sustained bear trend after failing to hold gains above 26,200, and the market is currently presenting a Low-2 short opportunity at the low of a bear bar near the 23,400 area. Each rally attempt has […]
Nasdaq 100 Profit-Taking After Reaching Measured Move Target
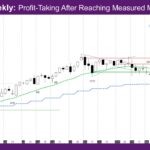
Market Overview: NASDAQ 100 E-mini Futures The NASDAQ E-mini futures week is a big bear bar reversing the past two weeks. This is likely profit-taking after reaching Measured Move target talked about in prior weekly reports. Most of the damage to the week was done on a single day Friday. The daily chart had a […]

