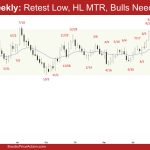
Market Overview: EURUSD Forex The EURUSD retest January low this week but lacked follow-through selling. The bulls see the current move (Feb 3) as a retest of the prior trend’s extreme low and want a higher low major trend reversal. If the market trades higher, the bears want the 20-week EMA to act as resistance. […]
Weekly Crude Oil Bear Leg
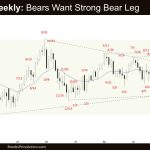
Market Overview: Crude Oil Futures The market formed a weekly Crude Oil bear leg testing the middle of the trading range. The bears want a strong bear leg to retest the bottom of the trading range. The bulls want a small sideways to up leg to retest the recent leg extreme high (Jan 15), even […]
Weekly Emini Weak Pullback
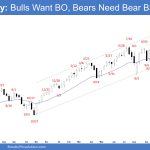
Market Overview: S&P 500 Emini Futures The market formed a weekly Emini weak pullback to the 20-week EMA. The bulls want a breakout into new all-time highs followed by a measured move based on the height of the recent 20-week trading range. The bears must do more to show that they are back in control. […]
DAX 40: Reading Context Like a Pro (Price Action)

Market Video Overview: DAX 40 Futures Tim Fairweather’s weekly report on the DAX 40 futures market. Follow Tim Fairweather’s YouTube channel for more Al Brooks price action analysis. Market analysis reports archive You can access all weekend reports on the Market Analysis page.
FTSE 100: Reading Context Like a Pro (Price Action)

Market Video Overview: FTSE 100 Futures Tim Fairweather’s weekly report on the FTSE 100 futures market. Follow Tim Fairweather’s YouTube channel for more Al Brooks price action analysis. Market analysis reports archive You can access all weekend reports on the Market Analysis page.
Nifty 50 Wedge Bottom
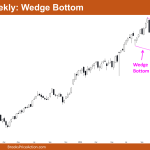
Market Overview: Nifty 50 Futures Nifty 50 Wedge Bottom on the weekly chart. This week, the market closed with a weak bullish sentiment and has yet to break out of the wedge bottom. It is also forming inside and outside bars, indicating a trading range price action. On the daily chart, Nifty 50 is trading […]
Nasdaq 100 Bull Bar with Big Tails at EMA
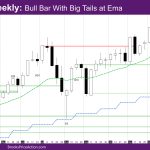
Market Overview: NASDAQ 100 Emini Futures The NASDAQ Emini futures week is a bull bar with big tails at EMA – exponential moving average. On the daily chart, the market continues to be in a trading range around the daily and weekly EMA. The monthly bar so far is an inside bar with tails. It […]
Emini Likely to Pullback for a Day or Two
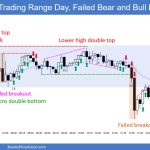
Trading Update: Friday February 7, 2025 Emini end of day video review Follow Joseph’s YouTube channel for more Al Brooks price action analysis. S&P Emini market analysis Emini daily chart Emini 5-minute chart and what to expect today Yesterday’s Emini setups Al created the SP500 Emini charts. Here are reasonable stop entry setups from yesterday. […]
Emini Buyers Likely below First Pullback
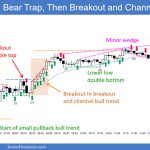
Trading Update: Thursday February 6, 2025 S&P Emini market analysis Emini daily chart Emini 5-minute chart and what to expect today Yesterday’s Emini setups Al created the SP500 Emini charts. Here are reasonable stop entry setups from yesterday. I show each buy entry bar with a green arrow and each sell entry bar with a […]
Emini Flat Moving Average on Daily
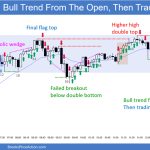
Trading Update: Wednesday February 5, 2025 S&P Emini market analysis Emini daily chart Emini 5-minute chart and what to expect today Yesterday’s Emini setups Al created the SP500 Emini charts. Here are reasonable stop entry setups from yesterday. I show each buy entry bar with a green arrow and each sell entry bar with a […]

