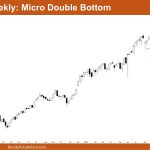
Market Overview: Nifty 50 Futures Nifty 50 Key Price Action & Breakout Analysis on the weekly chart. The market is currently trading within a wedge bottom and has not yet given a breakout. This week, it closed with a bearish candle that has a very small body. Traders should wait for the upcoming week’s close, […]
Nasdaq 100 Pair of Bars Like 11-4-2024
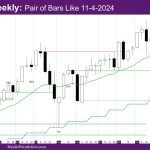
Market Overview: NASDAQ 100 Emini Futures The NASDAQ Emini futures week is a bear trend bar with a small tail on the top and reversing most of last week’s bullishness – a pair of bars like 11-4-2024 pair, a big bull trend bar followed by a big bear trend bar. On the daily chart, the […]
Emini Failed Breakout above January 24th Major Lower High
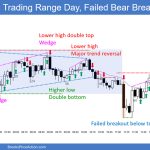
Trading Update: Friday February 21, 2025 S&P Emini market analysis Emini daily chart Emini 5-minute chart and what to expect today Yesterday’s Emini setups Al created the SP500 Emini charts. Here are reasonable stop entry setups from yesterday. I show each buy entry bar with a green arrow and each sell entry bar with a […]
Emini Follow-Through Buying at Resistance
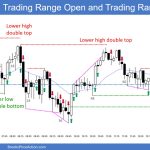
Trading Update: Thursday February 20, 2025 Emini end of day video review Follow Joseph’s YouTube channel for more Al Brooks price action analysis. S&P Emini market analysis Emini daily chart Emini 5-minute chart and what to expect today Yesterday’s Emini setups Al created the SP500 Emini charts. Here are reasonable stop entry setups from yesterday. […]
Emini Disappointing Follow-Through for Bulls
Trading Update: Wednesday February 19, 2025 Emini end of day video review Follow Joseph’s YouTube channel for more Al Brooks price action analysis. S&P Emini market analysis Emini daily chart Emini 5-minute chart and what to expect today Yesterday’s Emini setups Al created the SP500 Emini charts. Here are reasonable stop entry setups from yesterday. […]
Emini near All-Time High
Trading Update: Tuesday February 18, 2025 Emini end of day video review Follow Joseph’s YouTube channel for more Al Brooks price action analysis. S&P Emini market analysis Emini daily chart Emini 5-minute chart and what to expect today Friday Emini setups – Before US holiday break Al created the SP500 Emini charts. Here are reasonable […]
Bitcoin Pressure Builds for a Breakout
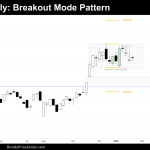
Market Overview: Bitcoin On the weekly chart, Bitcoin continues within a Breakout Mode Pattern (BOM) that follows a strong bull breakout from an 8-month Trading Range that had developed over the past year. On the daily chart, a BOM pattern that formed at the top of a trading range has already broken to the downside. […]
EURUSD Bulls Need a Breakout
Market Overview: EURUSD Forex The EURUSD bulls need a breakout above the January 27 high with follow-through buying trading far above the bear trend line and the 20-week EMA to increase the odds of the bull leg beginning. The bears ope the 20-week EMA and the bear trend line will act as resistance. EURUSD Forex […]
Crude Oil Bears Want a Strong Bear Leg
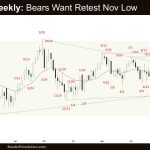
Market Overview: Crude Oil Futures The Crude Oil bears want a strong bear leg to retest the November low area. They need to create a follow-through bear bar following this week’s close below the 20-week EMA. The bulls need to create strong bull bars closing near their highs to show that they are back in […]
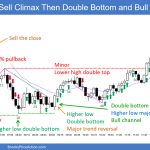
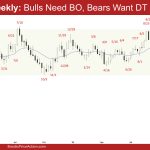
Weekly Emini Retest of All-Time High
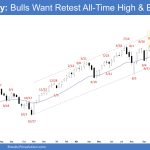
Market Overview: S&P 500 Emini Futures The market s forming a weekly Emini retest of all-time high. The bulls want a breakout into new all-time highs followed by a measured move based on the height of the 21-week trading range. The bears want a reversal from a double top (Dec 6 and Jan 24) and […]

