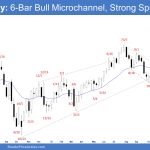
Market Overview: S&P 500 Emini Futures The market formed an Emini strong reversal on the Monthly chart, reversing the majority of the selloff of the prior 3 months. The next targets for the bulls are the July 27 high and the all-time high. The bears see the current rally as a retest of the July […]
Nasdaq 100 Highest Close of 2023
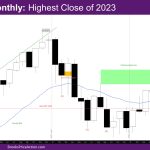
Market Overview: NASDAQ 100 Emini Futures The NASDAQ Emini futures November monthly candlestick is a big bull trend bar with a small tail above. It is the highest close of 2023 closing just below the July 2023 high. The week is a doji bull outside bar (OB) going below and above last week. NASDAQ 100 Emini […]
DAX 40 Bull Trend Bar above MA, Test Highs
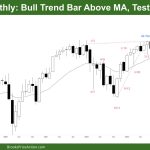
Market Overview: DAX 40 Futures DAX futures had a bull trend bar last month, closing on its high. It is a buy signal for next month, but the 1:1 target would be a new ATH. It is also reasonable that if we get up to the high of that sell climax, those 3 bear bars, […]
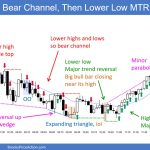
FTSE 100 Bull Inside Bar at MA, BOM, Trendline
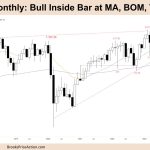
Market Overview: FTSE 100 Futures FTSE 100 futures was a bull inside bar on the monthly chart. Inside bars, MA, triangles, think breakout mode (BOM) and sit on the hands until a clear entry sets up. Bulls might have a High 2 above the MA, but the bear channel is tight, and the first reversal […]
Nifty 50 Head And Shoulders
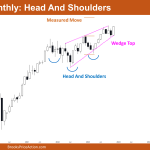
Market Overview: Nifty 50 Futures Nifty 50 Head and Shoulders on the monthly chart. The Nifty 50 made a strong bull bar and closed close to its high this month. It is currently trading close to the wedge-top pattern’s top. Bulls may expect this trend to continue until the measured move is reached, as the Nifty […]
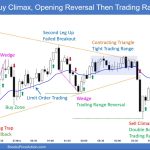
Emini High 1 Buy Signal Bar at Resistance
Trading Update: Friday December 1, 2023 S&P Emini pre-open market analysis Emini daily chart Emini 5-minute chart and what to expect today Yesterday’s Emini setups Al created the SP500 Emini charts. Here are reasonable stop entry setups from yesterday. I show each buy entry bar with a green arrow and each sell entry bar with […]
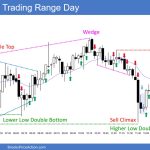
Emini Wedge Top at Resistance
Trading Update: Thursday November 30, 2023 S&P Emini pre-open market analysis Emini daily chart Emini 5-minute chart and what to expect today Emini intraday market update Yesterday’s Emini setups Al created the SP500 Emini charts. Here are reasonable stop entry setups from yesterday. I show each buy entry bar with a green arrow and each […]
Emini May Test September 1st High Today
Trading Update: Wednesday November 29, 2023 S&P Emini pre-open market analysis Emini daily chart Emini 5-minute chart and what to expect today Yesterday’s Emini setups Al created the SP500 Emini charts. Here are reasonable stop entry setups from yesterday. I show each buy entry bar with a green arrow and each sell entry bar with […]
Emini Pullback Likely Over Next Few Weeks
Trading Update: Tuesday November 28, 2023 S&P Emini pre-open market analysis Emini daily chart Emini 5-minute chart and what to expect today Emini intraday market update Yesterday’s Emini setups Al created the SP500 Emini charts. Here are reasonable stop entry setups from yesterday. I show each buy entry bar with a green arrow and each […]
Emini Pullback to Moving Average Likely
Trading Update: Monday November 27, 2023 S&P Emini pre-open market analysis Emini daily chart Emini 5-minute chart and what to expect today Emini intraday market update Pre-Thanksgiving Emini setups Richard created the SP500 Emini chart (Al on Thanksgiving leave). Here are reasonable stop entry setups from Wednesday before Thanksgiving break. I show each buy entry […]

