
This page is restricted for Trading Course or Trading Room members only. Please log in to view content. Nome de usuário ou email Senha Lembrar-me Esqueci a senha
Emini likely to rally after reaching 20% correction
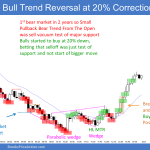
Trading Update: Monday May 23, 2022 Emini pre-open market analysis Emini daily chart Emini likely to rally this week after market reached a 20% correction (3,839.8) on Friday. The market reached a 19% correction on May 12, however the odds were any bounce would be minor, and the market would have to fall below the […]
Reversões de tendência

This page is restricted for Trading Course or Trading Room members only. Please log in to view content.
Suporte e Resistência

This page is restricted for Trading Course or Trading Room members only. Please log in to view content.
EURUSD Forex failed breakout from final flag
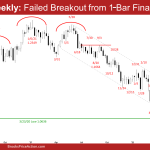
The EURUSD Forex pulled back after testing the 2017 low. The 10-day tight trading range from the end of April potentially is the final flag of the trend. Bulls want at least a 2 legged sideways to up pullback following a parabolic wedge (August 20, November 24, May 13) and a trend channel line overshoot.
likely be minor and traders expect at least a small second leg sideways to down after the pullback.
Nasdaq 50 percent retracement from pandemic low to all time high
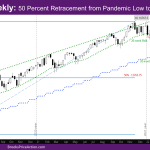
Market Overview: NASDAQ 100 Emini Futures This week’s Nasdaq Emini candlestick is an outside bear bar with a close above last week’s low. This is the seventh consecutive week with a bear bar. The market is at a Nasdaq 50 percent retracement from the low of the pandemic to the all-time high. Buyers on higher time frame […]
S&P500 Emini bears follow through on weekly chart
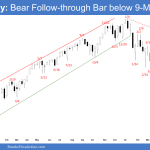
The bears got a bear follow-through bar on the S&P 500 Emini futures weekly chart. There are 7 consecutive bear bars on the weekly chart, something that has not happened since February 2001. It increases the odds of a bull bar within the next 1- to 3-weeks.
pullback (bounce) would be minor.
Nifty 50 futures double bottom at bottom of trading range
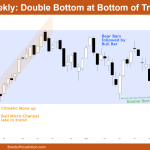
Market Overview: Nifty 50 Futures The Nifty 50 futures on the weekly chart formed a double bottom at bottom of trading range which is also the bottom of a bull micro channel. Nifty 50 on daily chart still in the broad bear channel and forming wedge bottom near March month low which is strong support. Nifty 50 […]
DAX 40 double bottom in bear channel
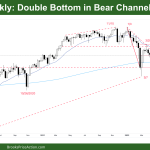
Market Overview: DAX 40 Futures DAX 40 futures moved slightly higher last week with a DAX 40 double bottom in a bear channel. It is a tightening range so it’s breakout mode. It looks more bullish on the daily chart however with a possible higher low major trend reversal. The bulls want some follow through […]
FTSE 100 tight trading range at 20-week MA
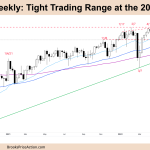
Market Overview: FTSE 100 Futures FTSE 100 tight trading range with market moving sideways last week as traders decide on a direction. We have had at least 2 breakouts in either direction so we can expect more sideways trading next week. It is a tightening range on the daily which is favoring limit order traders […]

