
Eu sempre assumo que, em todo mercado majoritário, não pode ocorrer nenhuma operação sem que haja ao menos uma instituição disposta a entrar no lado da compra, e outra instituição disposta a entrar do lado da venda. Eu também assumo que ambas sabem como ganhar dinheiro, o que significa que quase sempre existe, a qualquer […]
Price action e gráficos de candlestick

A maioria dos traders bem-sucedidos usam gráficos de candlestick para ganhar seu dinheiro, e operam principalmente ou exclusivamente utilizando Price Action. Embora não exista uma definição universal sobre o que é Price Action, eu uso a mais ampla, e digo que é simplesmente qualquer movimento do preço, para cima ou para baixo, em qualquer gráfico, […]
Emini likely bull close today and bears disappointed
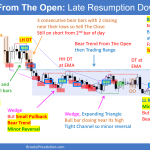
Trading Update: Tuesday April 12, 2022 Emini pre-open market analysis Emini daily chart Emini likely bull close today despite bears closing gap from the March 3 breakout point, which increases the odds for more trading range price action. The bears had a big bear breakout bar yesterday. The bears will want to try and get […]
Emini bears trying to reach March 3 breakout point
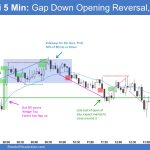
Trading Update: Monday April 11, 2022 Emini pre-open market analysis Emini daily chart Friday closed as a bear doji bar just under 4,500. The March 3 breakout point is an obvious magnet below (4,405). It is close enough to 4,400 that the market will likely have to test both price levels soon, so the market […]
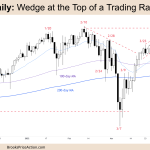
Nasdaq pullback in bull leg of trading range
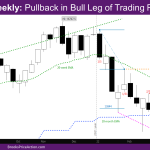
Market Overview: NASDAQ 100 Emini Futures This week’s Nasdaq Emini candlestick was a bear bar closing on its low, a pullback in bull leg. It triggered last week’s Low 2 sell signal and closed below the weekly EMA. The week started strong, attempting to retest last week’s high, but reversed down again at the swing lower high […]
EURUSD Forex reversing lower from wedge bear flag
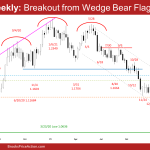
Market Overview: EURUSD Forex EURUSD Forex reversing lower from a wedge bear flag on the Daily Chart. The sell-off is in a 7-bar bear micro channel which means persistent selling. Odds favor at least a small second leg sideways to down after a pullback (bounce). EURUSD Forex market The Weekly EURUSD chart This week’s candlestick on […]
S&P 500 Emini pullback on weekly chart
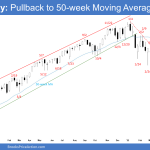
Market Overview: S&P 500 Emini Futures S&P 500 Emini pullback on weekly chart. Bulls want a re-test of the March 29 high and a continuation higher to re-test the trend extreme. Bears want a reversal lower from a double top bear flag with the February high. Odds slightly favor a second leg sideways to up after the […]
Nifty 50 futures measuring gap near triangle top
Market Overview: Nifty 50 futures Nifty 50 futures measuring gap near 17900 with a weak bull bar at the top of an expanding triangle, and overall NIFTY 50 remained up by 1% this week. Nifty 50 futures The Weekly Nifty 50 chart Deeper into the price action Last few bars have been closing near their […]
DAX futures triggered low 1 sell
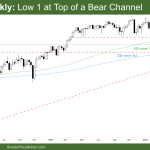
Market Overview: DAX 40 Futures DAX futures triggered low 1 sell on the weekly but with a tail below so not as bearish as it could be. We had 2 consecutive daily big bear bars closing below their midpoints last week. Is it a pullback from a tight bull channel or a broad bear channel? […]
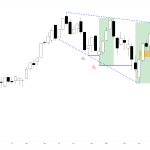
FTSE 100 futures market traded higher
Market Overview: FTSE 100 Futures The FTSE futures market traded higher in a tight bull channel to a possible wedge top at the top of a trading range. The channel is tight enough to expect higher prices next week and any reversal to be minor. The bears will continue to sell new highs and scale in, […]

