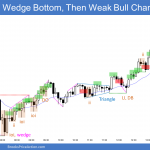
Emini and Forex Trading Update:Friday March 19, 2021 Pre-Open market analysis of daily chart Yesterday was a bear day after a 5-day Emini micro wedge top. It opened near Wednesday’s open, and Wednesday was a big bull day. A big bear day after a big bull day with very little overlap of the bodies means […]
Emini outside up day formed just below 4,000 Big Round Number
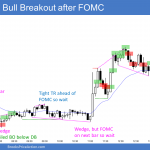
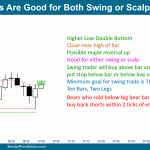
Emini and Forex Trading Update:Thursday March 18, 2021 I will update again at the end of the day. Pre-Open market analysis of daily chart Yesterday traded below Tuesday’s low and then above its high following the FOMC announcement. Yesterday was therefore an Emini outside up day. The Emini also made another new all-time high. 10-day […]
Emini Low 2 top ahead of FOMC announcement
Emini and Forex Trading Update:Wednesday March 17, 2021 I will update again at the end of the day. Pre-Open market analysis The Emini formed a small bear doji bar yesterday. This is an Emini Low 2 top with Thursday’s high. The bears see it as a 2nd failed breakout. But the 9-day bull channel is […]
Emini triggered High 1 buy signal just below 4,000
Emini and Forex Trading Update:Tuesday March 16, 2021 I will update again at the end of the day. Pre-Open market analysis The Emini formed a bull bar that closed near its high yesterday, and this is within a strong 8-day rally (Emini triggered High 1 buy signal). The bulls want the Emini to break strongly […]
Emini High 1 bull flag buy signal just below 4,000 Big Round Number
Emini and Forex Trading Update:Monday March 15, 2021 I will update again at the end of the day. Pre-Open market analysis As was likely, Friday pulled back from a new high and a 6-bar bull micro channel on the daily chart. Also, there were buyers below Friday’s low. Friday is now a High 1 bull […]
Scalping series:
#02 Scalping 2-minute Emini chart
Video duration 46min 04sec. Scalping 2-minute Emini chart — Video transcript Introduction I’m Al Brooks. Thank you very much for watching this video. It’s the second part of a series on scalping. I’m using a 2-minute Emini chart as an example. If you’re interested in finding some detailed rules about scalping, you can look […]
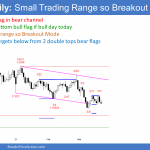
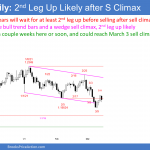
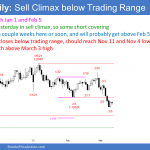
Emini should test the 4,000 Big Round Number next week
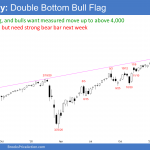
Market Overview: Weekend Market Analysis The SP500 Emini futures market broke to a new all-time high this week, and it should test 4000 Big Round Number next week. Friday is a High 1 bull flag buy signal bar on the daily chart. The Bond futures market has gone sideways for 3 weeks in a sell […]
Emini breakout to new high just below 4,000 magnet
Emini and Forex Trading Update:Friday March 12, 2021 I will update again at the end of the day. Pre-Open market analysis The Emini broke to a new all-time high yesterday, but failed to close at a new high. The break above the February 24 lower high erased the bearishness of last week’s 3 consecutive bear […]
Emini stuck at the 3,900 Big Round Number since early February
Emini and Forex Trading Update:Thursday March 11, 2021 I will update again at the end of the day. Pre-Open market analysis The Emini formed a small bull doji bar yesterday on the daily chart. It tested the 3,900 Big Round Number, like most days since early February. It is also testing the February 24 lower […]
Emini forming another lower high since February top
Emini and Forex Trading Update:Wednesday March 10, 2021 I will update again at the end of the day. Pre-Open market analysis The Emini has been in a trading range since early February. There have been many strong legs up and down, but every one reversed. Yesterday was another example. The Emini rallied but could not […]

