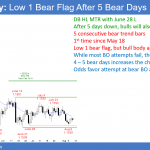
Emini pullback from parabolic wedge top on 60 minute chart I will update again at the end of the day. Pre-Open market analysis The Emini had another trading range day yesterday. Its high was below Tuesday high, and therefore yesterday is a High 1 bull flag. But, yesterday had a bear body and is therefore […]
Emini pullback from parabolic wedge top on 60 minute chart
Emini parabolic wedge top at measured move target
Intraday market update: Wednesday August 8, 2018
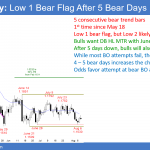
Emini parabolic wedge top at measured move target I will update again at the end of the day. Pre-Open market analysis The Emini rallied for 4 days in a tight bull channel on the 60 minute chart. This is extreme and unsustainable, and therefore climactic. It pulled back in a tight range yesterday from a […]
TradersEXPO Back to the Futures event
Friday, July 20, 2018 at the CME

Back to the futures trading event Al Brooks along with other top professional futures traders presented at the Chicago Mercantile Exchange (the Holy Futures Shrine?!). A rare and exclusive event for futures traders. Al Brooks presentation: When: Friday, July 20, 2018Topic: Advanced Emini Scalping CME presentation videos Al’s presentation was not recorded by the organizers. […]
Emini buy vacuum test of July high and all-time high
Intraday market update: Tuesday August 7, 2018
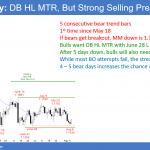
Emini buy vacuum test of July high and all-time high I will update again at the end of the day. Pre-Open market analysis Yesterday was the 3rd consecutive strong bull trend day. It broke above last week’s high and the July high. However, the 5 minute chart has been in a tight bull channel for […]
Emini follow-through buying after consecutive outside day
Intraday market update: Monday August 6, 2018
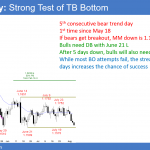
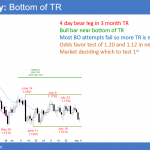
Emini follow-through buying after consecutive outside day I will update again at the end of the day. Thursday was an outside up day after an outside down day on Wednesday. It was therefore a buy signal bar. Friday was the entry bar on the daily chart, and it provided reasonable follow-through buying. This increases the […]
Emini consecutive outside bars in a bull flag
Emini weekend update: August 4, 2018
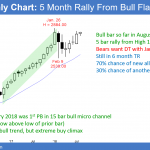
Monthly S&P500 Emini futures candlestick chart:Strong test of all-time high The monthly S&P500 Emini futures candlestick chart is in a bull trend after a 3 month bull flag. A new all-time high is likely within a couple of months. The bears need a strong bear bar this month if they are going to get a […]
Emini buyers below last week’s sell signal bar
Intraday market update: Friday August 3, 2018
Emini buyers below last week’s sell signal bar I will update again at the end of the day. Pre-Open market analysis I have been saying for the past week that the bears would get a 50 – 100 point pullback over the next couple of weeks, and then the Emini would resume up to a […]
Emini 2nd leg down in early August after buy climax
Intraday market update: Thursday August 2, 2018
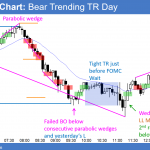
Emini 2nd leg down in early August after buy climax I will update again at the end of the day. Pre-Open market analysis The Emini sold off strongly yesterday and formed an outside down day prior to the 11 a.m. FOMC announcement. However, it closed above the low and the daily chart had a tail […]
Emini 50% retracement of 2 day selloff ahead of FOMC
Intraday market update: Wednesday August 1, 2018
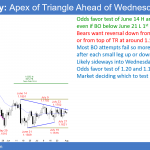
Emini 50% retracement of 2 day selloff ahead of FOMC I will update again at the end of the day. Pre-Open market analysis Yesterday retraced about half of the 2 day selloff. The odds were that the Emini would bounce at the 20 day EMA and try to get more neutral ahead of today’s FOMC […]
Emini follow-through selling in sell climax down to 2800
Intraday market update: Tuesday July 31, 2018
Emini follow-through selling in sell climax down to 2800 I will update again at the end of the day. Pre-Open market analysis The bears got follow-through selling yesterday. However, the bulls rallied off the 20 day EMA, the 2800 Big Round Number, and the March high. After 2 days of climactic selling down to support, […]

