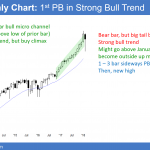
Monthly S&P500 Emini futures candlestick chart: 1st pullback after 16 bar bull micro channel The monthly S&P500 Emini futures candlestick chart had its 1st pullback in 16 bars. The bulls bought below January’s low. The month so far has a big tail below, which indicates strong buying. The monthly S&P500 Emini futures candlestick chart finally […]
Emini sell climax ended at 10% correction
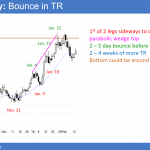
Emini testing resistance of lower high and moving average
Intraday market update: February 16, 2018
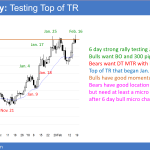
Emini testing resistance of lower high and moving average Updated 6:45 a.m. The Emini reversed up strongly from the moving average on the open. However, it was mostly sideways for the final hour of yesterday and it is within that range. In addition, it is at the target of last week’s lower high. That might […]
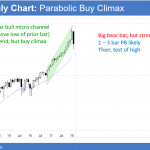
Emini in tradable bull leg to above 2750 in developing trading range
Intraday market update: February 15, 2018
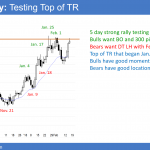
Emini in tradable bull leg to above 2750 in developing trading range Updated 6:45 a.m. The Emini gapped up and immediately reversed down with a big bear bar. The bulls created an opening reversal up from above yesterday’s high and kept the gap open. The next bar sold off again. This is an early tight […]
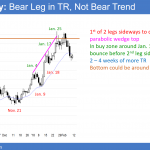
Emini bull leg in trading range after tradable bottom
Intraday market update: February 14, 2018
Emini bull leg in trading range after tradable bottom Updated 6:44 a.m. Today opened with a big gap down to the 60 minute EMA and the open of the week. It reversed up strongly and then down strongly. Traders do not want to use stop entries when the bars are huge. This is therefore a […]
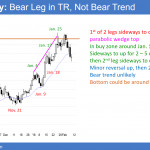
Emini bull leg in developing trading range after 10% correction
Intraday market update: February 13, 2018
Emini bull leg in developing trading range after 10% correction Updated 6:44 a.m. The Emini tested the 60 minute moving average and the open of the week on the open. The bulls are trying for an Opening Reversal up from this support and an early low of the day. The odds are that the Emini […]
Emini 10 percent correction but monthly bull flag
Intraday market update: February 12, 2018

Emini 10 percent correction but monthly bull flag Updated 6:45 a.m. The Emini gapped up on the open, but the gap was small. Moreover, the 60 minute moving average, and yesterday’s high and close were magnets below. Finally, this early rally is forming a wedge top with the 2 highs from Friday. Unless the bulls […]
Emini tradable bottom in developing 2 to 3 month trading range
Emini weekend update: February 10, 2018
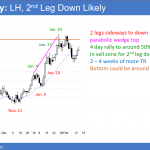
Monthly S&P500 Emini futures candlestick chart: Big, but brief reversal The monthly S&P500 Emini futures candlestick chart this month traded below last month’s low. This is the 1st pullback in 16 months. The bar is currently a big bear bar, but there are 3 weeks left to the month. Hence, it could look different on […]
Emini technical selloff from historically overbought higher time frame charts
Intraday market update: February 9, 2018
Emini technical selloff from historically overbought higher time frame charts Updated 6:41 a.m. Today gapped above yesterday’s bear channel. However, the 1st bar was a doji bar in the middle of yesterday’s late selloff. A neutral bar in the middle of something is a sign of complacency. It therefore increases the odds of a trading […]
Emini buy and sell climaxes before government shutdown vote
Intraday market update: February 8, 2018
Emini buy and sell climaxes before government shutdown vote Updated 6:48 a.m. Monday’s buy signal is stronger than yesterday’s sell signal. The Emini was sideways yesterday and it will likely continue today. This means that traders will look for the 1st 1 – 3 hour trend to reverse and then start an opposite swing. The […]
Emini sell climax after buy climax so trading range likely
Intraday market update: February 7, 2018
Emini sell climax after buy climax so trading range likely Updated 6:43 a.m. The Emini began in yesterday’s hour long tight trading range, just below yesterday’s high and the 60 minute EMA. Since yesterday is a buy signal bar, the early break above its high triggered the buy signal on the daily chart. But, the […]

