BPA trading room Q&A: November 20, 2015 Any advice for a swing trader who wants to stay with the Always In direction until the Always In clearly changes how they do this today? Video duration: 4min 24sec You can also view this video on Al’s YouTube Channel if needed. Video transcript—Swing traders staying Always […]
Emini weekend update for January 16, 2016:
Day trading tip is to look for a rally after the sell climax at support
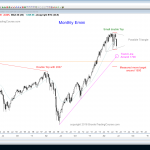
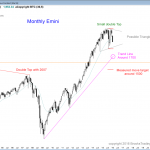
Monthly S&P500 Emini futures candlestick chart: Triangle bull flag The monthly S&P500 Emini futures candlestick chart is having a 3rd push down in a trading range, creating a triangle. The monthly S&P500 Emini futures candlestick chart has 2 weeks left to the month and the candlestick pattern might be different from what it is today. […]
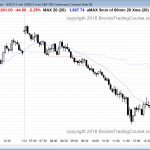
Intraday market update: January 15, 2016
Learn how to day trade at support
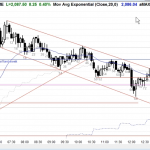
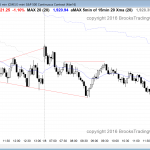
Posted 6:48 a.m. The Emini opened with a huge gap down to just below 60 minute moving average targets and just above the September low. It was also a 60 minute wedge bottom. It reversed up from the 1st bar. At the moment, it is Always In Long, and has about a 40% chance of […]
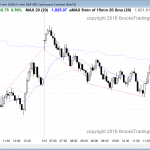
Intraday market update: January 14, 2016
Day traders expect trading range price action after sell climax
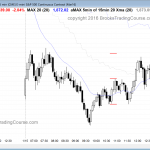
Posted 7:52 a.m. The Emini had a strong reversal up. I was trading actively and was delayed in posting this. The Emini is clearly Always In Long, but the rally is a buy climax at the 60 minute moving average. The odds are that it will go sideways to down for at least an hour […]
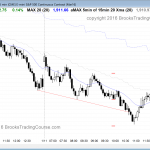
Intraday market update: January 13, 2016
Day traders expect the price action to remain sideways to up
Posted 7:06 a.m. Although the day failed twice above yesterday’s high, is overbought, and quickly became Always In Short, the 1st 2 bars had bull bodies, the 1st bar was a doji, and the Emini is still in a tight bull channel. There are reasonable arguments for the bulls and bears, and some trading range […]
Intraday market update: January 12, 2016
Day trading tip is to expect trading range price action
Posted 7:00 a.m. The Emini gapped up and formed a trend from the open bull trend, but the bodies were not big, the tails were prominent, and it was far above the moving average. It tested back into the October 5 gap as expected, and then tested down. This is a trading range open, and […]
Intraday market update: January 11, 2016
Learn how to trade a sell climax at support
Posted 7:03 a.m. Although the Emini sold off from the open, the follow-through bars were bad. Given the context, which favors 1 – 3 days of sideways to up, and the bad follow-through down, the odds are that this initial selloff will become a bear leg in a trading range. The selloff has been strong […]
Ask Al: Nike stock chart review

BPA trading room Q&A: December 23, 2015 Can you talk about the Nike five-minute chart? Video duration: 7min 40sec You can also view this video on Al’s YouTube Channel if needed. Video transcript—Nike stock chart review Nike—not an easy day’s trading Yeah. Nike was an interesting chart today. So was Freeport-McMoRan, it was way oversold […]
Emini weekend update: January 9, 2016:
Price action favors a pullback after a sell climax
Monthly S&P500 Emini futures candlestick chart: Middle of trading range The monthly S&P500 Emini futures candlestick chart is back to the middle of the 2 year trading range and again below the moving average. The monthly S&P500 Emini futures candlestick chart has a bear trend bar for its candlestick pattern, but it is early in […]
Intraday market update: January 8, 2016
Learn how to trade after a sell climax
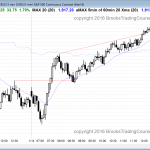
I will post around 6:56 a.m. The Emini triggered an expanding triangle bear flag short after the 2nd bar of the day. However, it reversed up 4 times from the bottom of the October 5 gap, and each time it did so from a lower low. The odds are that the bulls will not wait […]

