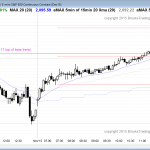
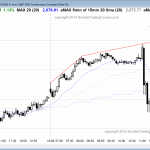
Posted 7:15 a.m. The Emini opened with a trend from the open bull trend, but the bull breakout bars had bad follow-through. That increased the chances that the rally was a bull leg in what would become a trading range. There was a parabolic wedge top just after 7 a.m. This increased the odds for […]
Intraday market update: November 2, 2015
Ask Al: Making profit then passing on trades

BPA trading room Q&A: September 28, 2015 When I’m making some profit, I tend to become very careful in my decision-making and I end up missing a lot of trades. What should I do? Audio duration: 3min 45sec Audio transcript Making profit but then being too careful That’s okay. Here’s my thought on that. […]
Emini weekend update: October 31, 2015:
Traders learning how to trade should not buy a buy climax
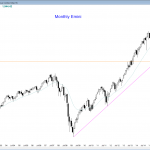
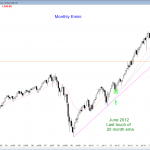
Monthly S&P500 Emini futures candlestick chart: Bulls need follow-through in November The monthly S&P500 Emini futures candlestick chart reversed the August sell-off, but needs follow-through buying. Otherwise, the trading range will continue. The monthly S&P500 Emini futures candlestick chart rallied strongly in October and reversed almost all of the August selloff. There was a 20 […]
Intraday market update: October 30, 2015
Learn how to trade a buy vacuum test of resistance
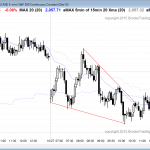
Posted 7:13 a.m. The day began with a trend from the open bear trend, but the bars had big tails and were in the middle of yesterday’s trading range. Also, bulls were able to make money repeatedly by buying below bars and scalping. That combination made the initial selloff more likely a bear leg in […]
Intraday market update: October 29, 2015
Learn how to trade a pullback after a buy climax
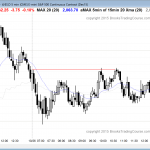
Posted 7:22 a.m. The Emini opened with a gap down to the moving average, but the opening reversal up lacked consecutive big bull bars closing on their highs. The rally was more likely a bull leg in a developing trading range. Although the Emini is Always In Long, there is a 75% chance of at […]
Intraday market update: October 28, 2015
Learn how to trade an FOMC report
Posted 7:07 a.m. The Emini rallied from an opening reversal. The reversal came from above the moving average, which is unusual and therefore lowers the probability that this will be a strong bull trend day. The rally was strong enough to make the Emini Always In Long. However, this is the 4th day in a […]
Intraday market update: October 27, 2015
Learn how to trade an island top
Posted 7:27 a.m. The Emini gapped down and formed a 2 day island top. It reversed up from above the bottom of Friday’s gap up. The reversal was at the 60 minute moving average. The rally was a trend from the open bull trend and it closed today’s gap down by going above yesterday’s low, […]
Intraday market update: October 26, 2015
Learn how to trade the markets when exhausted
Problems with the server so 7:12 update was lost. I wrote that the Emini was in a bear swing in a probable trading range day, and that it would probably have swings up and down, each lasting at least a couple of hours. Pre-Open Market Analysis S&P 500 Emini: Learn how to trade the markets […]
Ask Al: What trading drawdowns to expect
BPA trading room Q&A: October 6, 2015 What kind of drawdowns should a trader expect at different stages of their development? Audio duration: 7min 09sec — Scroll down for chart references at end Audio transcript Trading drawdowns — Your risk on any one trade Well, obviously that’s very open-ended and there’s so many variables, […]
Emini weekend update: October 24, 2015:
Those who trade the markets for a living see buy climaxes
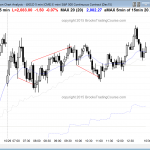
Monthly S&P500 Emini futures candlestick chart: Breakout above 2 month bull flag The monthly S&P500 Emini futures candlestick chart is reversing up strongly from the 1st pullback to the moving average in 38 months. The monthly S&P500 Emini futures candlestick chart is forming a strong entry bar above last month’s weak buy signal bar. The 1st […]

