Posted 7:25 a.m. The Emini began with reversals up and down in a narrow range, which was a triangle, and it was in breakout mode. When that is the case, bulls look for a small bull reversal bar near the bottom that closes on its high, and bears want a bear reversal bar at the […]
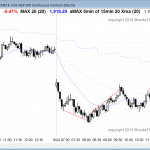
Intraday market update: October 2, 2015
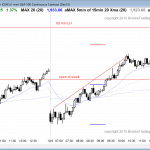
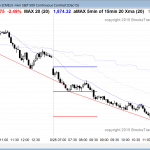
Intraday market update: October 1, 2015
Learn how to trade the markets when price action is confusing
Posted 7:15 a.m. The Emini reversed down from above yesterday’s high and then had an opening reversal up from the 15 minute moving average. The selloff fro the open was about 15 points, which is a lot and it reduced the chances that today will be able to close much above the open of the […]
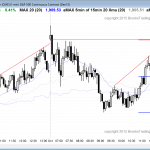
Intraday market update: September 30, 2015
Learn how to trade the markets when oversold
Posted 7:32 a.m. The Emini gapped up and then formed both a small double top and double bottom. Breakout mode is the most common setup to happen after a big gap up or down. Traders can buy the high 2 or sell the low 2, and the reward is much bigger than the risk, but […]
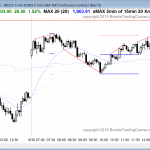
Intraday market update: September 29, 2015
Learn how to trade a bear rally
Posted 7:03 a.m. The Emini reversed up strongly from below yesterday’s low. It formed a wedge bottom on the 5 minute chart and an expanding triangle on the 60 minute chart. The targets are the September 1 low and the 60 minute moving averages. The Emini is Always In Long, and the reversal up was […]
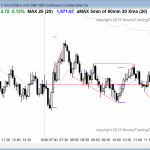
Intraday market update: September 28, 2015
High probability trading near the bottom of a trading range
Posted 7:24 a.m. The Emini ended with a small rally Friday. It formed a double top bear flag, and today’s open fell below yesterday’s low, which was the neckline of the bear flag. It fell for more than a measured move down, and it tested the September low, which is the bottom of the month […]
Emini weekend update: September 26, 2015:
Learn how to trade a doji candlestick pattern
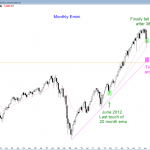
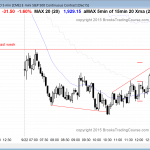
Monthly S&P500 Emini futures candlestick chart: Learn how to trade a doji candlestick pattern The monthly S&P500 Emini futures candlestick chart closes on Wednesday. It is currently a doji at the monthly moving average, but that might change early next week. The monthly S&P500 Emini futures candlestick chart is neutral going into next week. Bulls […]
Intraday market update: September 25, 2015
Traders learning how to trade the markets will look for a bull trend

Posted 7:24 a.m. The Emini gapped up above yesterday’s high, the low of last week, and yesterday’s bull channel, but immediately found sellers. The low of last week might be the most important magnet today, as I discussed below. The Emini began with a tight trading range within Tuesday’s and Wednesday’s range. The bears wanted […]
Intraday market update: September 24, 2015
Learn how to trade the markets near the bottom of a trading range
Posted 7:31 a.m. The Emini began with a series of bear trend bars after its gap down, but because the past 4 days have been mostly sideways and the Emini is near support, bears know that a reversal up and low of the day can happen at any time. This makes them quick to take […]
Intraday market update: September 23, 2015
Learn how to trade the markets after a Globex bull trend reversal
Posted 8:06 a.m. The Emini opened again in a tight trading range, which increased the chances of a lot of trading range price action today. The odds are that the Emini will rally to test the 1969 lower high by the end of the week. It is in a trading range on the daily chart, […]
Intraday market update: September 22, 2015
Learn how to trade a big gap down
Posted 7:12 a.m. The Emini began with a trading range open, which meant that day traders began to look for a double bottom or wedge bottom to buy, or a double top or wedge top to sell. It was a limit order market initially. The bulls wanted a reversal up above last week’s low because […]

