
Monthly S&P500 Emini futures candlestick chart: 80% chance of 10% pullback this year The monthly S&P500 Emini futures candlestick chart is extremely overbought, but there is no sign of a top. This month’s candlestick closes on Tuesday, and it might be a bear inside bar and therefore a sell signal bar. The monthly S&P500 Emini […]
Emini weekend update: June 27, 2015:
Intraday market update: June 26, 2015
Learn how to trade a sell climax
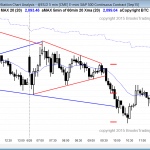
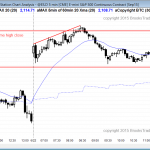
Posted 7:15 a.m. The Emini had a strong opening reversal up from below yesterday’s low and reversed down from the bear trend line and from above the trading range. There is a 70% chance that we’ve seen the low of the day and probably an 80% chance that the Emini will close above the open, […]
Intraday market update: June 25, 2015
Learn how to trade a reversal
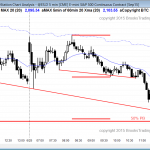
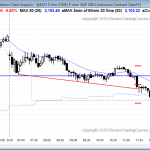
Posted 7:00 a.m. The Emini had strong follow-through selling on the open from an expanding triangle bear flag. The bulls now need an expanding triangle bottom to begin to achieve their goal of at least 2 hours of sideways to up trading. Because of the dojis and big tails on the reversal up, sideways for […]
Intraday market update: June 24, 2015
Day trading for beginners in a trading range
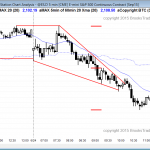
I will post around 7:30 a.m. The week or two before the 4th of July is usually the 2nd quietest time of the year (Christmas week is the quietest), and trading this week has had a lot of small legs and reversals, and many sideways bars with prominent tails. This is holiday trading. However, there […]
Intraday market update: June 23, 2015
Price action trading strategies for a bull flag
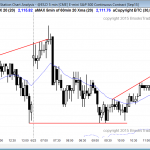
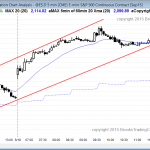
Posted 7:40 a.m. The Emini began with a limit order open, which increases the chances of more trading range price action throughout the day. When the Emini begins with a tight trading range, traders wait for a breakout with follow-through in either direction. However, a strong trend day becomes less likely. At the moment, the […]
Intraday market update: June 22, 2015
Learn how to trade a test of resistance
Posted 7:25 a.m. The Emini gapped up and had an opening reversal up from a brief selloff to test yesterday’s high. However, the rally has not been strong. Whenever there is a big gap, the Emini usually goes sideways for an hour or two until it gets closer to the moving average, and then it […]
Ask Al: Brooks Trading Course update
BPA trading room Q&A: April 21, 2015 When are you planning on releasing new videos for your trading course? Can you discuss what it will cover?Audio duration: 5min 36sec — Scroll down for video slide samples and transcript. Brooks Trading Course update Video slide samples – No audio narration (4min 20sec) This video is […]
Emini weekend update: June 20, 2015:
Learn how to trade the markets in a buy climax
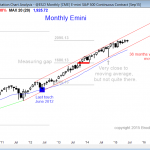
Monthly S&P500 Emini futures candlestick chart: Strong bull trend, but overbought The monthly S&P500 Emini futures candlestick chart is in an overbought bull trend and the odds favor a test of the moving average over the next few months. The monthly S&P500 Emini futures candlestick chart is exceptionally overbought and it has an 80% chance […]
Intraday market update: June 19, 2015
Day trading strategies at the top of the range
Posted 8:39 a.m. The Emini opened with a trading range just below the moving average and just above the high of last week. This is a breakout mode open, and a limit order market for scalpers. Most day traders should wait for a strong breakout with follow-through up or down. The swing trade should go […]
Intraday market update: June 18, 2015
Learn how to swing trade
Posted 7:04 a.m. The Emini began with a trend from the open bull trend. However, it might be forming a parabolic wedge top near last week’s high. If there is a strong sell signal bar after the 3rd push up, swing bears will sell. Bears wanting a higher probability short will wait for a strong […]

