I will not post today. My daughter asked me to spend the day with her to attend her classes at the Harvard Business School, which I am hoping will be fun. I will be back on Wednesday. See the weekly update for a discussion of the weekly chart and for what to expect going into […]
Intraday market update, April 6, 2015:
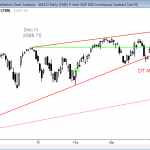
Emini weekend update: April 3, 2015:
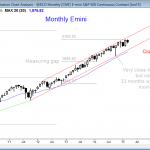
Monthly sell signal bar
Monthly S&P500 Emini candle chart: Bear ioi sell signal The monthly Emini candle chart is in a strong bull trend, but it formed another bear ioi sell signal with March’s close. The monthly S&P500 cash index has not touched the moving average in 34 months, which is a type of buy climax. Any unsustainable behavior […]
Intraday market update, April 2, 2015:
Bull channel testing the bull trendline
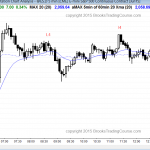
Posted 7:00 a.m. The bulls had a breakout above yesterday’s trading range and strong follow-through. This reaffirms the always in long condition. The breakout is big enough so the there probably will be buyers below for at least one more leg up. With so much time spent sideways over the past week, this breakout might […]
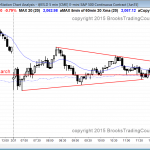
Intraday market update, April 1, 2015:
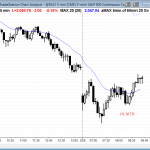
Bear trend channel within a trading range

I will post around 7:03 a.m. The Emini had a strong bear breakout on the open and is always in short. However, this is climactic selling and the market is far below the moving average. The stop is far away so the risk has increased. The computers have to reduce their risk and this means […]
Intraday market update, March 31, 2015:
Monthly sell signal bar
Posted 6:56 a.m. The bulls tried for an opening reversal at the 60 minute moving average and the bears wanted a breakout pull back short below yesterday’s low. Instead, the day began with a limit order market in the middle of the month’s range. Traders learning how to trade the markets need to be patient […]
Intraday market update, March 30, 2015:
Trading range and in breakout mode
Posted 6:50 a.m. The Emini opened with a big gap up and a bull breakout, and continued the always in long rally from early Friday. The bears need either a trading range to generate selling pressure or a parabolic wedge top. There is no evidence of either yet. Until then, bulls will swing and scalp, […]
Emini weekend update: March 28, 2015:
Double top and double bottom bull flag on the daily chart
Monthly S&P500 Emini candle chart: Bear inside bar in a buy climax The monthly Emini candle chart is forming a bear inside bar after an outside bar. This ioi is a breakout mode setup. The monthly S&P500 Emini candle chart is extremely overbought, and this ioi pattern is a potential top. There are 2 trading […]
Intraday market update, March 27, 2015:
Double bottom and a double top
Posted 6:57 a.m. I will here for only the first 2 hours today, but I will be home on Monday and will be here all day again. The Emini opened with a tight trading range within yesterday’s 5 hour trading range. It is in breakout mode. There have been many breakouts over the past 5 […]
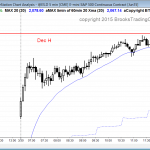
Intraday market update, March 26, 2015:
Sell climax in a bear trend
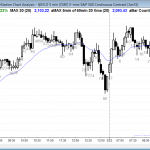
Poster 6:49 a.m. Yesterday’s low tested the bottom of the wedge channel that began on March 18. The FOMC rally was the 2nd leg up in the wedge. Traders learning to trade the markets know that wedge trend reversals typically have at least 2 legs down, and the first leg often ends at the bottom […]
Intraday market update, March 25, 2015:
Bear trend day
I am traveling today and was unable to post, but I will post tomorrow, Thursday, and Friday. The Emini sold off strongly today and is deciding whether the 20% correction has begun, or instead if it is forming a triangle on the daily chart for one more new high before the correction begins. The month […]

