Trading Update: Monday August 5, 2024 End of day video review S&P Emini pre-open market analysis Emini daily chart Emini 5-minute chart and what to expect today Friday’s Emini setups Al created the SP500 Emini charts. Here are reasonable stop entry setups from Friday. I show each buy entry bar with a green arrow and […]
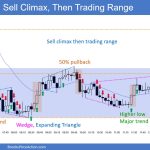
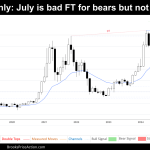
Monthly Emini Pullback
Market Overview: S&P 500 Emini Futures The market is forming a monthly Emini pullback following an extended rally. The bulls want the current pullback to be sideways and shallow. The bears need to create a strong bear bar in August with follow-through selling in September to increase the odds of retesting the 20-month EMA. S&P500 […]
Monthly Crude Oil Lower High
Market Overview: Crude Oil Futures The market formed a monthly Crude Oil lower high in July. The bears want a reversal from a lower high major trend reversal, a wedge bear flag (Sep 28, Apr 12, and Jul 5), and a double top bear flag (Apr 12 and Jul 5). The bulls hope that the current sideways-to-down […]
Monthly EURUSD Tight Trading Range
Market Overview: EURUSD Forex The market formed a monthly EURUSD tight trading range with candlesticks that are overlapping with alternating bull and bear bodies. The bulls hope to get another leg up breaking above the triangle to retest the December 28 high. The bears hope that the 20-month EMA and the bear trend line will act as […]
Bitcoin Struggles to Break $70000: Frustation for Bulls and Bears
Market Overview: Bitcoin Bitcoin exhibited exhibited considerable volatility on July, yet it failed to deliver decisive results for either bulls or bears. The repeated rejection of the $70,000 resistance implies that sideways to downward movement is likely in the coming months. The interplay between the $70,000 resistance and $50,000 support will likely define the medium-term […]
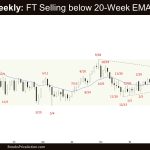
FTSE 100 Microchannel, Open Breakout Gap, Outside Bar
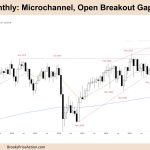
Market Overview: FTSE 100 Futures FTSE 100 futures went higher last month above the prior inside bar, breaking a bull microchannel. Traders expect more, but that can mean a pullback first to 50% or closing the breakout gap below. It is too high to buy up here, but traders might buy the new high with […]
DAX 40 Weak Buy Signal, Far From MA, TTR
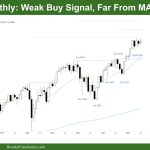
Market Overview: DAX 40 Futures DAX futures went sideways last month with a weak buy signal and a small bull doji. It’s too high to buy above those bars, but some bulls will buy a new high. Stop is far away. DAX seems to pull back sharply after a tight trading range on the monthly chart, […]
Nasdaq 100 Pause Bar After Two Big Bull Bars
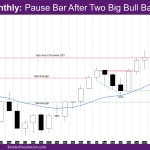
Market Overview: NASDAQ 100 Emini Futures The NASDAQ Emini futures July monthly candlestick is a big bear doji bar with a big tail above and below. It is at least a pause bar after two big bull bars, and a bad sell signal bar. The week is a bear bar with a good body, a long […]
Nifty 50 Measuring Gap Measured Move
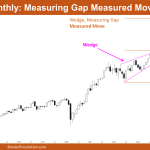
Market Overview: Nifty 50 Futures Nifty 50 Measuring Gap Measured Move on the monthly chart. This month, the market showed a strong bullish close and surpassed the significant milestone of 25,000. The measured move target, considering both the measuring gap and the wedge overshoot, has yet to be reached. Therefore, traders should anticipate at least […]
Emini Strong Bear Reversal Bar
Trading Update: Friday August 2, 2024 S&P Emini pre-open market analysis Emini daily chart Emini 5-minute chart and what to expect today Yesterday’s Emini setups Al created the SP500 Emini charts. Here are reasonable stop entry setups from yesterday. I show each buy entry bar with a green arrow and each sell entry bar with […]

