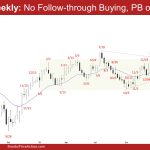
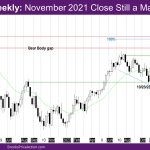
Market Overview: EURUSD Forex There was no EURUSD follow-through buying on the weekly chart. Is this simply a pullback to be followed by another leg up completing the wedge pattern (with the first two legs being February 22 and March 8), or is the market forming a lower high major trend reversal? Traders will see […]
Bitcoin stalls around $70000 after a buy vacuum test of the all-time high
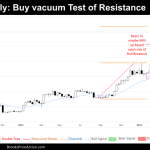
Market Overview: Bitcoin The Bitcoin weekly chart shows a late-stage bull breakout, which raises concerns about a potential trend shift, either to sideways trading or a reversal. Bears might short here, while bulls are cautious. The daily chart action paints a different picture. Stuck in a bull channel without a clear Always In signal, short-term […]
FTSE 100 High 2 Triggers But Bear Bar, Always In Long
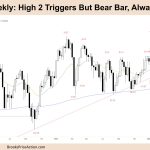
Market Overview: FTSE 100 Futures FTSE 100 futures moved higher last week when the High 2 was triggered. It looks like a bull breakout of BOM in a broad bull channel. Sloping up MA and big bull bars over the MA are good signs for buyers at the MA and lower. MM targets up are […]
DAX 40 Measured Move Overshoot, Around 18000
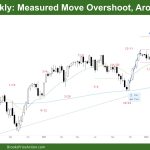
Market Overview: DAX 40 Futures DAX futures moved higher last week with a measured move overshoot from a bull bar with tails above and below. The bears have nothing on the weekly so more up likely. The daily chart is starting to show signs of trading range action but expect buyers at 18000 and the […]
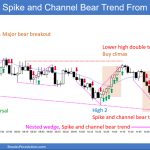
Nasdaq 100 Bears Needed a Bear Trend Bar Closing Far Below 3-4
Market Overview: NASDAQ 100 Emini Futures The NASDAQ Emini futures week is a bear bar with a tail above. Bears needed a bear trend bar closing far below 3-4. Instead, the market just triggered the bear bar of last week and closed slightly above last week’s low. On the daily chart, bears are taking more […]
Nifty 50 Wedge Top
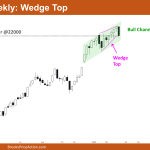
Market Overview: Nifty 50 Futures Nifty 50 Wedge Top on the weekly chart. This week, the market showcased a significant bearish momentum, reflected by a strong bear bar. However, it remains within the confines of a bullish channel, diminishing the likelihood of an immediate reversal. Despite the bearish breakout from the wedge top, bears require […]
Emini Bears Want Close below Moving Average
Trading Update: Friday March 15, 2024 S&P Emini pre-open market analysis Emini daily chart Emini 5-minute chart and what to expect today Yesterday’s Emini setups Al created the SP500 Emini charts. Here are reasonable stop entry setups from yesterday. I show each buy entry bar with a green arrow and each sell entry bar with […]
Emini Inside Bar Sign of Trading Range
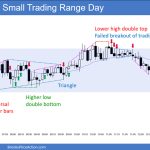
Trading Update: Thursday March 14, 2024 S&P Emini pre-open market analysis Emini daily chart Emini 5-minute chart and what to expect today Yesterday’s Emini setups Al created the SP500 Emini charts. Here are reasonable stop entry setups from yesterday. I show each buy entry bar with a green arrow and each sell entry bar with […]
Emini Bears Want Sellers above March 8th
Trading Update: Wednesday March 13, 2024 S&P Emini pre-open market analysis Emini daily chart Emini 5-minute chart and what to expect today Yesterday’s Emini setups Al created the SP500 Emini charts. Here are reasonable stop entry setups from yesterday. I show each buy entry bar with a green arrow and each sell entry bar with […]
Emini Sellers above High 1
Trading Update: Tuesday March 12, 2024 S&P Emini pre-open market analysis Emini daily chart Emini 5-minute chart and what to expect today Yesterday’s Emini setups Al created the SP500 Emini charts. Here are reasonable stop entry setups from yesterday. I show each buy entry bar with a green arrow and each sell entry bar with […]

