Trading Update: Thursday March 7, 2024 S&P Emini pre-open market analysis Emini daily chart Emini 5-minute chart and what to expect today Yesterday’s Emini setups Al created the SP500 Emini charts. Here are reasonable stop entry setups from yesterday. I show each buy entry bar with a green arrow and each sell entry bar with […]
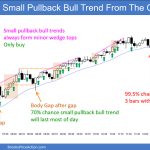
Emini Buyers near Moving Average
Trading Update: Wednesday March 6, 2024 S&P Emini pre-open market analysis Emini daily chart Emini 5-minute chart and what to expect today Yesterday’s Emini setups Al created the SP500 Emini charts. Here are reasonable stop entry setups from yesterday. I show each buy entry bar with a green arrow and each sell entry bar with […]
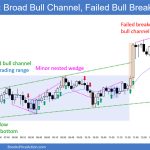
Emini Profit Taking on Daily Chart
Trading Update: Tuesday March 5, 2024 S&P Emini pre-open market analysis Emini daily chart Emini 5-minute chart and what to expect today Yesterday’s Emini setups Al created the SP500 Emini charts. Here are reasonable stop entry setups from yesterday. I show each buy entry bar with a green arrow and each sell entry bar with […]
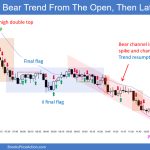
Emini Bulls Hopeful for Follow-through Buying
Trading Update: Monday March 4, 2024 S&P Emini pre-open market analysis Emini daily chart Emini 5-minute chart and what to expect today Friday’s Emini setups Al created the SP500 Emini charts. Here are reasonable stop entry setups from Friday. I show each buy entry bar with a green arrow and each sell entry bar with […]
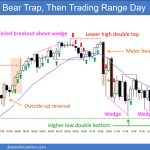
Emini Breakout
Market Overview: S&P 500 Emini Futures The monthly chart formed an Emini breakout above the prior all-time high. The bulls will need to create a follow-through bull bar in March to confirm the breakout even if it is just a bull doji. The bears will need a strong sell signal bar or a micro double […]
Crude Oil Wedge
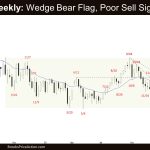
Market Overview: Crude Oil Futures The monthly chart is forming a Crude Oil wedge bear flag. The bulls will need to create a follow-through bull bar closing above the 20-month EMA to increase the odds of the bull leg beginning. The bears want a retest of the December low from a wedge bear flag (Dec […]
EURUSD Doji
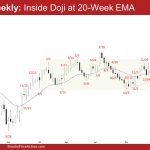
Market Overview: EURUSD Forex The monthly chart formed a EURUSD doji in the middle of the trading range and at the 20-month EMA. The bulls want the 20-month EMA to act as support. The bears will need to create follow-through selling below the 20-month EMA to increase the odds of a retest of the October […]
Bitcoin at 60k after an impressive bull run
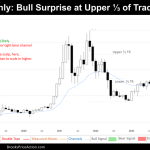
Market Overview: Bitcoin Welcome back to the Bitcoin Report. In our last report, we cautiously eyed January’s big doji as a potential double top, raising concerns about a price reversal. However, February defied expectations with a powerful bull breakout bar, propelling the price from $40,000 to a staggering $60,000 – a remarkable +40% surge. Now, […]
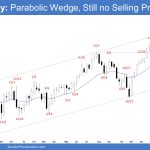
Nifty 50 Wedge Overshoot
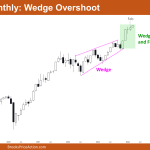
Market Overview: Nifty 50 Futures Nifty 50 Wedge Overshoot on the monthly chart. The market on the monthly chart showed a very small bull close in February. Following the wedge overshoot, bulls managed to generate strong and consecutive bull bars, increasing the likelihood of a measured move up based on the bull breakout of the […]
FTSE 100 High 2 in Bull Trend, Expect More Up
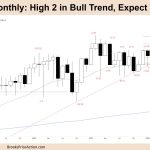
Market Overview: FTSE 100 Futures FTSE 100 futures moved sideways last month in a doji after a High 2 in a small pullback bull trend. Tight trading range and many dojis but bull breakout and follow-through closing on their highs and above the MA so better to be long or flat. Bears can argue a […]

