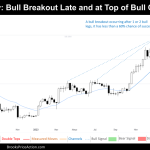
Market Overview: Bitcoin Bitcoin started the week on a high note, the previous week’s candlestick closing as a strong bull bar. This fueled expectations for a retest of the prior week’s high, but the current weekly bar paints a different picture. It’s shaping up as a bearish reversal, suggesting bulls are losing steam as the […]
Nifty 50 Reversal Attempt Failed
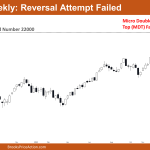
Market Overview: Nifty 50 Futures Nifty 50 Reversal Attempt Failed on the weekly chart. In this week’s market analysis, we observe a small bullish bar formation with a tail at the bottom. Despite attempts by bears to initiate a strong reversal, the bullish trend remains robust, resulting in a failed reversal. Notably, the Nifty 50 […]
FTSE 100 Pause After Buy Signal, High in TR
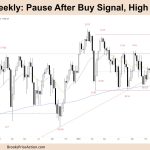
Market Overview: FTSE 100 Futures FTSE 100 futures moved sideways to up last week after a slight pause above the MA. The bulls managed to get a strong spike earlier, and now it looks like we have bull follow-through. Most traders are hesitant to hold while in a triangle and BOM. I think we are […]
DAX 40 Breakout and MM Targets Above, ATH
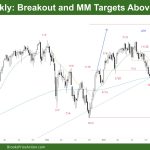
Market Overview: DAX 40 Futures DAX futures moved higher in a bull breakout last week. Consecutive bull bars at a new ATH, so most traders should be long or flat. We are starting to get a lot of sideways price action, so it is a channel, and many bulls will scale-in lower and scale-out at […]
Emini Profit Taking Likely
Trading Update: Friday February 23, 2024 S&P Emini pre-open market analysis Emini daily chart Emini 5-minute chart and what to expect today Yesterday’s Emini setups Al created the SP500 Emini charts. Here are reasonable stop entry setups from yesterday. I show each buy entry bar with a green arrow and each sell entry bar with […]
Emini Buyers at Daily Moving Average
Trading Update: Thursday February 22, 2024 S&P Emini pre-open market analysis Emini daily chart Emini 5-minute chart and what to expect today Yesterday’s Emini setups Al created the SP500 Emini charts. Here are reasonable stop entry setups from yesterday. I show each buy entry bar with a green arrow and each sell entry bar with […]
Emini Testing Daily Moving Average
Trading Update: Wednesday February 21, 2024 S&P Emini pre-open market analysis Emini daily chart Emini 5-minute chart and what to expect today Yesterday’s Emini setups Al created the SP500 Emini charts. Here are reasonable stop entry setups from yesterday. I show each buy entry bar with a green arrow and each sell entry bar with […]
Emini Sideways for Several Weeks
Trading Update: Tuesday February 20, 2024 S&P Emini pre-open market analysis Emini daily chart Emini 5-minute chart and what to expect today Yesterday’s Emini setups Al created the SP500 Emini charts. Here are reasonable stop entry setups from yesterday. I show each buy entry bar with a green arrow and each sell entry bar with […]
Emini Stalled
Market Overview: S&P 500 Emini Futures The Emini stalled around the all-time high by closing as an outside bear doji. The bulls want a strong breakout into a new all-time high territory, hoping that it will lead to many months of sideways to up trading. The bears hope to get a TBTL (Ten Bars, Two […]
Crude Oil Pullback Phase
Market Overview: Crude Oil Futures The weekly chart is in the Crude Oil pullback phase which has lasted 10 weeks so far. The bulls need to create sustained follow-through buying above the 20-day EMA and the bear trend line to increase the odds of the bull leg beginning. The bears see the recent sideways to […]

