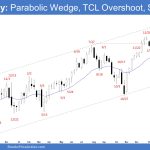
Market Overview: S&P 500 Emini Futures The weekly chart is in a tight bull channel which means strong bull, but it is also forming an Emini parabolic wedge (Nov 22, Dec 28, and Feb 9). The bulls need to continue creating follow-through buying above the all-time high. The bears want a reversal from a double […]
Crude Oil Overlapping Candlesticks
Market Overview: Crude Oil Futures Traders see Crude Oil Overlapping Candlesticks on the weekly chart which means the market is forming a tight trading range. The bulls will need to create sustained follow-through buying above the 20-day EMA and the bear trend line to increase the odds of the bull leg beginning. If the market […]
EURUSD Weak High 2 Setup
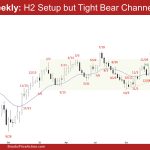
Market Overview: EURUSD Forex The weekly chart formed a EURUSD weak High 2 setup because it is following a tight bear channel. The bulls want a reversal from a double bottom bull flag (Dec 8 and Feb 6). The bears want a retest of the Feb 6 low followed by a breakout below. EURUSD Forex […]
Bitcoin big bull breakout but still BOM at resistance
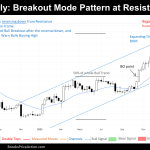
Market Overview: Bitcoin In previous editions of the Bitcoin Weekly Report, we anticipated the possibility of another leg down in the market. However, this week we might have seen a significant shift in dynamics with the emergence of a strong Bull Breakout Bar. Presently, the price appears to be within a small Expanding Triangle on […]
DAX 40 Expanding Triangle, Bull BO in Bull Channel
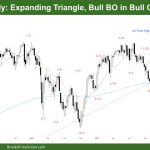
Market Overview: DAX 40 Futures DAX futures moved sideways last week in an expanding triangle and a bull breakout in a bull channel. The bulls got a good buy signal, but we haven’t raced up yet. because we are in the channel phase and traders are buying lower and taking profits at highs. Bulls are […]
Nifty 50 Bull Flag
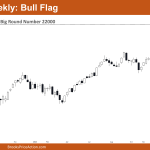
Market Overview: Nifty 50 Futures Nifty 50 Bull Flag on the weekly chart. On the weekly chart, Nifty 50 closed weakly bearish this week, with a small-bodied bear bar and tails on both sides. Currently, the market is ensconced within a triangle, which, given its formation within a bull trend, can also be termed a […]
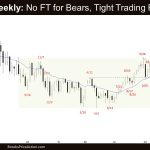
FTSE 100 Second Entry Short, But Closing on MA
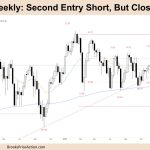
Market Overview: FTSE 100 Futures FTSE 100 futures moved lower last week with a bear outside down bar, a second entry short in a trading range. It’s a broad bull channel, and so bulls and bears can make money. Neither side is trapped yet, so we are sitting between 7000 and 8000. I prefer to […]
Emini Sideways Likely
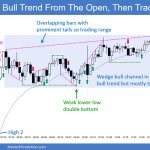
Trading Update: Friday February 9, 2024 S&P Emini pre-open market analysis Emini daily chart Emini 5-minute chart and what to expect today Yesterday’s Emini setups Al created the SP500 Emini charts. Here are reasonable stop entry setups from yesterday. I show each buy entry bar with a green arrow and each sell entry bar with […]
Emini near All Time High
Trading Update: Thursday February 8, 2024 S&P Emini pre-open market analysis Emini daily chart Emini 5-minute chart and what to expect today Yesterday’s Emini setups Al created the SP500 Emini charts. Here are reasonable stop entry setups from yesterday. I show each buy entry bar with a green arrow and each sell entry bar with […]
Emini Likely to Reach 5,000 Today
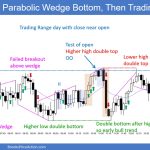
Trading Update: Wednesday February 7, 2024 S&P Emini pre-open market analysis Emini daily chart Emini 5-minute chart and what to expect today Yesterday’s Emini setups Al created the SP500 Emini charts. Here are reasonable stop entry setups from yesterday. I show each buy entry bar with a green arrow and each sell entry bar with […]

