Market Overview: FTSE 100 Futures The FTSE futures market has had shrinking volatility into breakout mode into a triangle near the MAs. While we will probably get a move up and a move down, until the bears break strongly below that bull trend line, the scale in bulls will continue to strongly buy lows and scalp. […]
DAX 40 Sideways at Bear Swing Target, Gap Closed
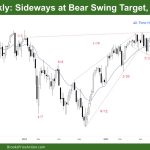
Market Overview: DAX 40 Futures DAX futures moved sideways last week, low in a trading range at the prior swing low. The bears closed the last gaps and have struggled to get a break below this possible wedge bottom channel line. Bulls want to buy, but it is still a low-probability trade until a good […]
Emini Second Leg Up Likely after Complex Bottom
Trading Update: Friday October 13, 2023 S&P Emini pre-open market analysis Emini daily chart Emini 5-minute chart and what to expect today Emini intraday market update Yesterday’s Emini setups Al created the SP500 Emini charts. Here are reasonable stop entry setups from yesterday. I show each buy entry with a green rectangle and each sell […]
Emini Pullback Likely
Trading Update: Thursday October 12, 2023 S&P Emini pre-open market analysis Emini daily chart Emini 5-minute chart and what to expect today Emini intraday market update Yesterday’s Emini setups Al created the SP500 Emini charts. Here are several reasonable stop entry setups from yesterday. I show each buy entry with a green rectangle and each […]
Emini 4,400 Big Round Number
Trading Update: Wednesday October 11, 2023 S&P Emini pre-open market analysis Emini daily chart Emini 5-minute chart and what to expect today Emini intraday market update Yesterday’s Emini setups Al created the SP500 Emini charts. Here are several reasonable stop entry setups from yesterday. I show each buy entry with a green rectangle and each […]
Emini Testing August 18th Low
Trading Update: Tuesday October 10, 2023 S&P Emini pre-open market analysis Emini daily chart Emini 5-minute chart and what to expect today Yesterday’s Emini setups Al created the SP500 Emini charts. Here are several reasonable stop entry setups from yesterday. I show each buy entry with a green rectangle and each sell entry with a […]
No report today — Brad travelling
Monday October 9, 2023 Brad will be back tomorrow… Friday’s Emini setups Al created the SP500 Emini charts. Here are several reasonable stop entry setups from Friday. I show each buy entry with a green rectangle and each sell entry with a red rectangle. Buyers of both the Brooks Trading Course and Encyclopedia of Chart […]
Bitcoin up to 28k but Limit Order Market and BOM
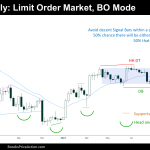
Market Overview: Bitcoin Bitcoin up to 28k. On the Weekly chart, the price is contained within a Trading Range Pattern, which is also a Breakout Mode (BOM) pattern. Most good signal bars are not good setups when the price is within a BOM. Until the BOM is not broken, Traders are in stand by mode, […]
Emini Test Breakout Point
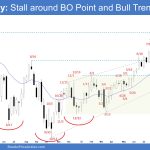
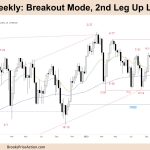
Market Overview: S&P 500 Emini Futures The weekly chart formed an Emini test breakout point; a two-legged pullback testing the February 2 high (breakout point) and the bull trend line. The bulls see the current move down simply as a 50% pullback (of the move which started in March) within a broad bull channel. If […]
Crude Oil Strong Pullback
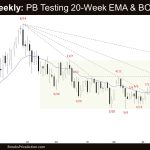
Market Overview: Crude Oil Futures The weekly chart formed a Crude Oil strong pullback testing the breakout point (April high; trading range high) and the 20-week EMA. The bulls want the 20-week EMA to act as a support and a reversal up from a higher low. The bears want a reversal down from a large […]

