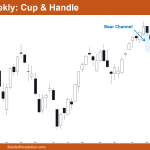
Market Overview: Nifty 50 Futures Nifty 50 cup & handle on the weekly chart, bulls failed to follow through after attempting a double bottom. Now that bears have closed a strong bear bar, some bears may decide to short the cup & handle pattern on the weekly chart. On the daily chart, price action is […]
Emini Bears Want Test of Last Year’s Close
Trading Update: Friday March 10, 2023 Emini pre-open market analysis Emini daily chart Emini 5-minute chart and what to expect today Emini intraday market update Yesterday’s Emini setups Al created the SP500 Emini charts. Here are several reasonable stop entry setups from yesterday. I show each buy entry with a green rectangle and each sell […]
Emini Bad High 1 Buy Setup, Probably Sellers Above
Trading Update: Thursday March 9, 2023 Emini pre-open market analysis Emini daily chart Emini 5-minute chart and what to expect today Emini intraday market update Yesterday’s Emini setups Al created the SP500 Emini charts. Here are several reasonable stop entry setups from yesterday. I show each buy entry with a green rectangle and each sell […]
Emini Trapped Bulls, Second Leg Down Likely

Trading Update: Wednesday March 8, 2023 Emini pre-open market analysis Emini daily chart Emini 5-minute chart and what to expect today Emini intraday market update Yesterday’s Emini setups Al created the SP500 Emini charts. Here are several reasonable stop entry setups from yesterday. I show each buy entry with a green rectangle and each sell […]
Emini First Reversal Down Probably Minor
Trading Update: Tuesday March 7, 2023 Emini pre-open market analysis Emini daily chart Emini 5-minute chart and what to expect today Emini intraday market update Yesterday’s Emini setups Al created the SP500 Emini charts. Here are several reasonable stop entry setups from yesterday. I show each buy entry with a green rectangle and each sell […]
Emini Likely 2nd Leg Up and Closure of February 10 Breakout Point Low
Trading Update: Monday March 6, 2023 Emini pre-open market analysis Emini daily chart Emini 5-minute chart and what to expect today Emini intraday market update Friday’s Emini setups Al created the SP500 Emini charts. Here are several reasonable stop entry setups from Friday. I show each buy entry with a green rectangle and each sell […]
Emini Higher Low, Strong Bull Bar
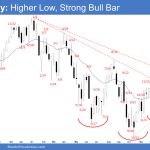
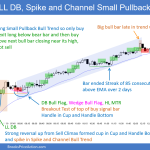
Market Overview: S&P 500 Emini Futures The weekly chart was a strong bull bar and the bulls hope that the S&P 500 Emini futures market is forming a higher low followed by another strong leg up. The bulls will need to create strong follow-through buying to increase the odds of a retest of the February 2 high. […]
Crude Oil Wedge Bull Flag but Trading Range
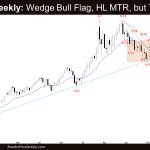
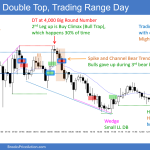
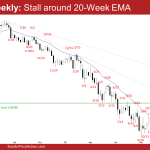
Market Overview: Crude Oil Futures The Crude oil futures weekly chart formed a Crude Oil wedge bull flag in a trading range. The weekly candlestick was a bull bar closing near the high. The bulls want a retest followed by a breakout above the 15-week trading range high. The bears got a reversal down from a wedge […]
EURUSD Bear Reversal Bar
Market Overview: EURUSD Forex The EURUSD Forex February monthly candlestick was a EURUSD bear reversal bar. The bears want this to be the start of the deeper pullback. Odds slightly favor the 6-bar bull micro channel streak to end soon. The bulls want any pullback to be shallow and sideways. If they get that, the […]
Bitcoin Futures Doji Bar
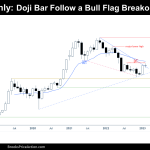
Market Overview: Bitcoin Futures Bitcoin Futures doji bar following bull flag breakout. During February, the price barely increased +0.69 of its value. Bitcoin is attempting to reverse a tight bear channel. So far, Bulls achieved some milestones and hence, limited the downside risks. Bitcoin futures The Monthly chart of Bitcoin futures Analysis Trading The Weekly […]

